by Econimica
What if rather than mathematical economic formula’s and double speak, we just looked at the population of potential workers by age group, and employment among them. Then cross reference against the Federal Reserve set Fed Funds rate, Federal Reserve purchased assets, and the debt these policies incentive (Federally, Corporately, Personally).
What is plain? There was a period of growth via population growth, a period of growth via increasing participation among females, and now a period of “growth” via ZIRP, QE, and unrepayable federal debt accrual. What is also obvious is the interplay of ZIRP, QE, and debt to inflate asset prices. All of the debt is undertaken to purportedly achieve the Fed’s mandate of “full employment” but nearly all the real benefits flow to a shrinking cadre of institutional and elderly asset holders. As for the poor, young adults, retirees living on fixed incomes…they are all punished via costs of living rising far faster than incomes thanks to the flow through of the higher asset prices.
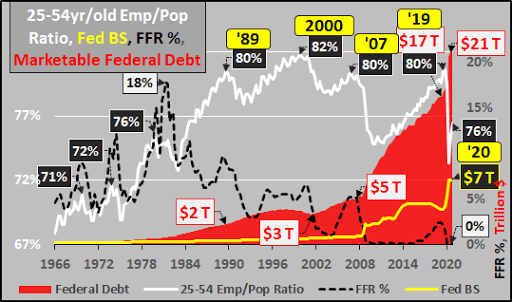
25 to 54 year old Population / Employees
25 to 54 year old population (blue line) vs. those employed among them (green line), Fed Funds Rate % (dashed black line), Federal Reserve assets (yellow line), and US federal government marketable Treasury debt (red shaded area).
1- Population growth decelerates into and through 2007…and entirely ceases thereafter.
2- 25 to 54 year old employment growth ends as of 2000, and has been essentially flat-lining for twenty years.
3- Fed funds rate essentially moves inverse the population/employment rate of growth…rising as rate of growth accelerated and falling as growth decelerated…and then turned ZIRP as population/employment ceased growth.
4- From 1981, as population/employment growth decelerated, the Fed Funds Rate was consistently cut to encourage the substitution of debt for the decelerating growth. But since 2007, as population/employment growth no longer existed, ZIRP plus QE were abused to encourage the explosion of unrepayable debt…and debt that can only be serviced at ZIRP or more likely NIRP.


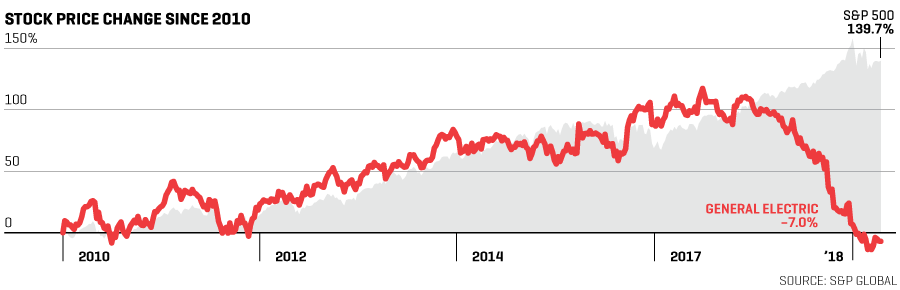
But to highlight the impact of the Federal Reserves reaction to no population/employment growth, check the Wilshire 5000 (representing all publicly traded US equity). The explosion of equities since ZIRP nicely mimics the surge in federal debt and Federal Reserve held assets.


To punctuate the full inclusion of females into the workforce, check the 25 to 54 year old male / female participation (yes, duplicate from above) coupled with the now identical participation rates among 15 to 24 year old males and females.

15 to 24 year old population, employees among them, and participation rate. Forty years of essentially zero population growth, declining employment among them, and declining participation begs the question of where economic, consumption, and financial growth will come from?

15 to 24 year old male, female participation. The rise, the 1989 peak of combined male/female participation, and thirty years of declining participation since.

15 to 74 year old Population / Employees


Looking at the 15 to 74 year old male and female participation, the clear peak in 2000 and declining participation is plain to see.


Note that the participation ratio (below) of 15 to 64 year old Japanese reached unheard of heights as of 2019.

This is solely due to females entering and staying in the workforce at higher rates than post-war Japan has ever seen.

In short, there was population growth, then female participation growth, and then the growth of ZIRP/NIRP, QE, and debt. The benefits of these different phases have shifted progressively toward the wealthiest. The Fed’s full employment mandate (somehow never achieved, according to the Fed) has simply turned into an excuse to encourage unlimited / unrepayable debt…creating untold wealth for a decreasing few at an ever increasing pace.