by: Steve St. Angelo
To understand the dynamics of the markets, we need to look at the technical indicators. While it’s true that technical analysis can’t guarantee how the market reacts in the near term, it provides excellent indicators over the longer run. And, if we look at the technical indicators in the markets now, they are setting up for one hell of a crash.
One of the best technical indicators that show whether a market (or asset) is over inflated or undervalued, is the 200 Moving Average. If we apply the 200 Moving Average (MA) to a daily chart, it’s a 200 Day moving average. If we apply it to a weekly chart, then its a 200 Week moving average and to a monthly chart, it’s a 200 Month moving average. The next series of charts will show how the 200 Month Moving Average (MMA) today compares to the peak, right before the 2008 Financial Crisis.
The Dow Jones Index in 2007 (at 14,000) was 75% above its 200 MMA. Again, these charts are monthly charts, and I will be referring to the 200 Month Moving Average as 200 MMA:
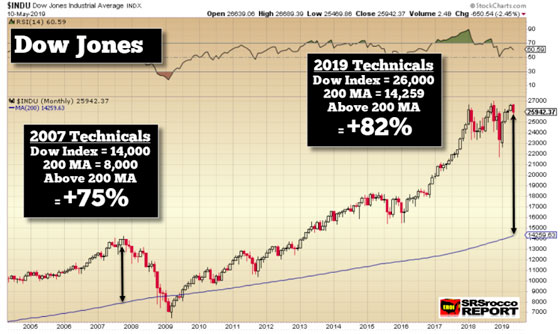
However, today, the Dow Jones is now 82% above its 200 MMA. So, we are severely overdue for a correction. All stocks and indexes eventually come back to their 200 MMA. It’s not only necessary, but it’s also healthy for the market. We cannot have rising stock values forever.
Now, if we look at the NASDAQ, the technical setup is even more extreme than the Dow Jones because tech stocks today are behaving more like the mania that took place before the Great Tech Crash in 2000. The NASDAQ is currently 112% above its 200 MMA:
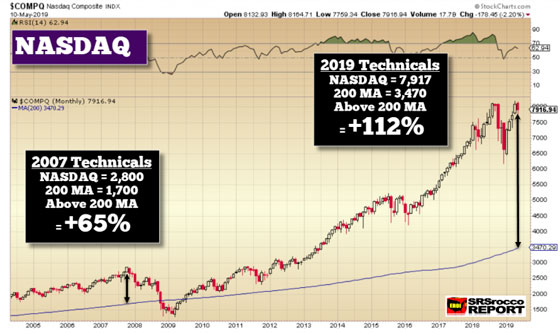
For the NASDAQ to correct back to the 200 MMA, it would have to lose more than half of its present value. As we can see, the major stock indexes today are even more inflated than they were before the 2008 financial crisis.
But, that is not true for Gold and Silver. I continue to receive emails from some followers who believe gold and silver will crash along with the broader markets. While we could see a brief selloff in the precious metals, I doubt it would be anything like it was in 2008-2009. If we look at the 200 MMA for gold and silver, the technical setup presently is the exact opposite of what it was in 2008:
First, let’s look at silver. In 2008, silver’s price was a staggering 212% above its 200 MMA:
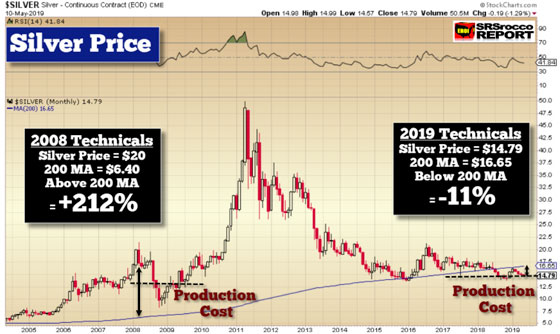
When silver was trading at $20 in 2008, its 200 MMA was $6.40. Thus, it was extremely overvalued as well as overbought. So, when the markets crashed, silver fell to the $8-$9 range. You will notice that I have included the approximate average production cost to produce silver in the two periods. Because the average annual price of oil surged higher since 2000, it impacted the cost to produce silver and gold. Thus, when the silver price fell below the production cost in 2008, it didn’t take long for it to move back above it in 2009.
Today, the silver price is currently 11% BELOW its 200 MMA. While this might be a negative technical indicator for traders, I only see that as temporary — more on this in an upcoming video. According to my analysis, the current breakeven for the primary silver mining industry is about $15 an ounce. Which means, we could see lower silver prices for the short term, but we must understand, silver is not overbought or overvalued by any stretch of the imagination, quite the contrary. Also, the breakeven price to produce precious metals continues to provide a floor in the silver and gold prices.
Furthermore, I had written articles and made videos showing that when the markets started to sell off, gold and silver went higher, not lower. The precious metals still act as a FEAR TRADE.
Secondly, the gold price is much closer to its 200 MMA today than it was in 2008:
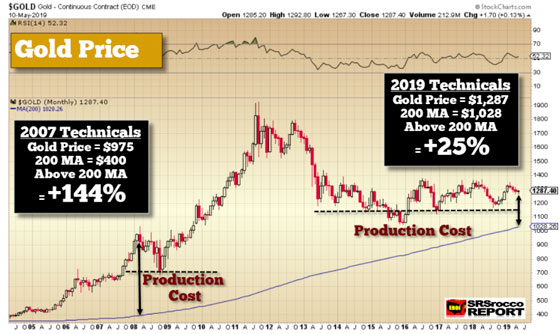
In 2008, the gold price was 144% above its 200 MMA versus only 25% higher today. Moreover, when the gold price corrected lower in 2008, it fell to the industry’s breakeven cost of about $650 an ounce. That was the reason it did not fall back to its 200 MMA. Also, as we can see over the past five years, the gold price has been bouncing off the $1,150 level as that is now its PRODUCTION COST FLOOR LEVEL. Yes, it’s true that gold fell below that in late 2015, but that was due to oil falling to $28 a barrel.
Some analysts are suggesting that we could see gold fall back to $1,000 during the next market crash before reversing and moving to new highs. While anything is possible, I don’t see that as a “LIKELY” outcome. Due to the continued falling ore grades, even at lower oil prices, the gold mining industry’s production cost continues to increase. Of course, if we were to get rid of 75+% of global gold production, costs could fall, but that much of a reduced supply would push prices to new highs… LOL.
The Major Factor To Determine Asset Values In The Future Not Considered By The Market
I am just briefly going to touch on this subject matter as I want to bring this article to a conclusion. I have shown in many articles how the oil price has been the LEADING DRIVER for higher gold and silver prices. Thus, the COST OF PRODUCTION has always been the floor price for precious metals. However, at some point, we are going to see a disconnect between how the oil price (and supply) will impact the value of most assets (stocks, bonds, and real estate) versus gold and silver.
Let me say this simply. The rising oil price, along with rising global oil production, has pushed up the value of most assets. However, when oil production peaks and declines, regardless of the oil price, most asset values will decline while the gold and silver prices (values) move higher. I will explain in more detail why I believe this to be true in future articles and videos.
In conclusion, the stock markets are seriously over-valued if we go by their 200 Month Moving Averages. The NASDAQ and tech stocks are more overvalued than the Dow Jones Index, similar to what they were during the 1997-1999 Tech Boom. However, the gold and silver prices are at the opposite spectrum versus the overall markets as they are undervalued and closer to their 200 MMAs. Hell, the silver price is 11% below its 200 MMA.
So, I believe the precious metals are setting up for one hell of a rally while the broader markets are primed for a crash.