
Is the bear market over yet?
This is the question that everyone wants to know. Why? So they can “buy the bottom.”
For that reason alone, I would suggest the current “bear market” is not over yet. Historically speaking, at the bottom of bear market cycles, as we saw in 1932, 1974, 2002, and 2008, there are few individuals willing to put capital at risk.
Given the large number of people on social media clamoring to jump back in the market given the rally this past Friday, it suggests that “optimism,” and “recency bias,” are still far too prevalent in the market.
As noted in this past weekend’s newsletter, Bob Farrell, a legendary investor, is famous for his 10-Investment Rules to follow.
“Rule #8 states:
Bear markets have three stages – sharp down, reflexive rebound and a drawn-out fundamental downtrend.”
- Bear markets often START with a sharp and swift decline.
- After this decline, there is an oversold bounce that retraces a portion of that decline.
- The longer-term decline then continues, at a slower and more grinding pace, as the fundamentals deteriorate.
Dow Theory also suggests that bear markets consist of three down legs with reflexive rebounds in between.
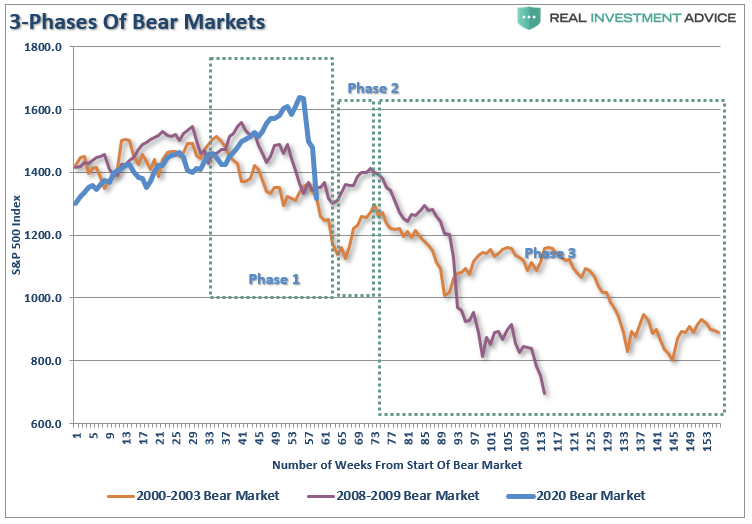
While the correction has been sharp in recent weeks, it hasn’t inflicted enough “emotional pain” to deter individuals from jumping back in. As I stated:
“That selloff sets up a ‘reflexive bounce.’ For many individuals, they will ‘feel like’ they are ‘safe.’ This is how ‘bear market rallies’ lure investors back just before they are mauled again in ‘Phase 3.’”
Just like in 2000, and 2008, the media/Wall Street will be telling you to just “hold on.” Unfortunately, by the time “Phase 3” was finished, there was no one wanting to “buy” anything.
That’s how you know a “bear market” is over.
Price To Profits & Earnings
From an investment view, I prefer more data-driven analysis to determine if the current bear market is over.
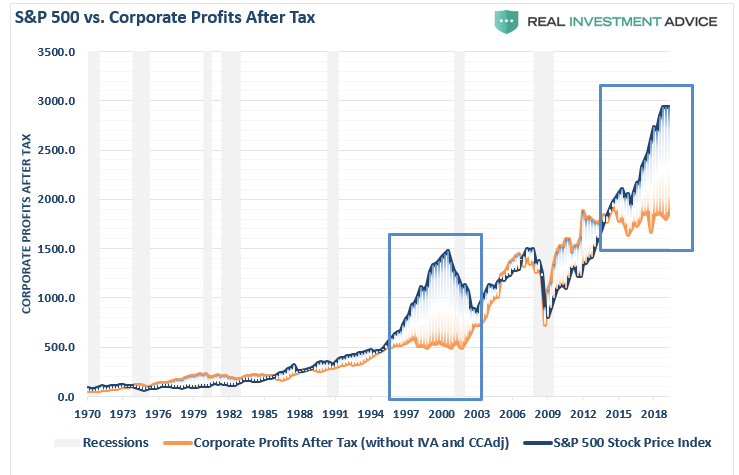
In a previous post, I discussed the deviation of the stock market from corporate profitability. To wit:
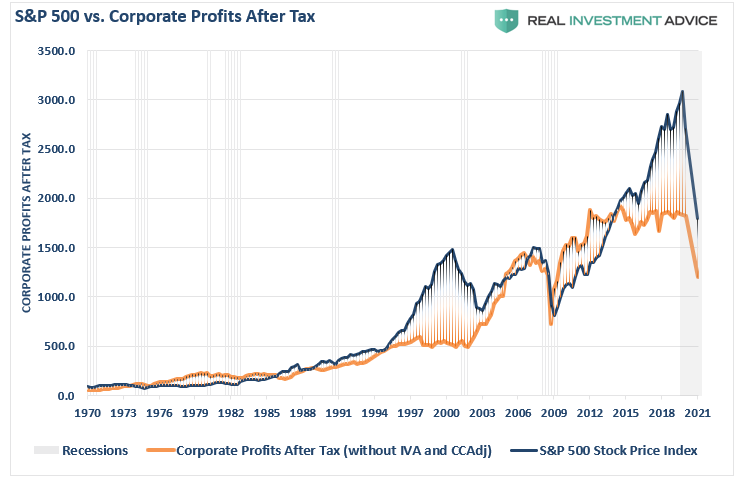
“If the economy is slowing down, revenue and corporate profit growth will decline also. However, it is this point which the ‘bulls’ should be paying attention to. Many are dismissing currently high valuations under the guise of ‘low interest rates,’ however, the one thing you should not dismiss, and cannot make an excuse for, is the massive deviation between the market and corporate profits after tax. The only other time in history the difference was this great was in 1999.”
It isn’t just the deviation of asset prices from corporate profitability which is skewed, but also reported earnings per share.
As I have discussed previously, the operating and reported earnings per share are heavily manipulated by accounting gimmicks, share buybacks, and cost suppression. To wit:
“It should come as no surprise that companies manipulate bottom-line earnings to win the quarterly ‘beat the estimate’ game. By utilizing ‘cookie-jar’ reserves, heavy use of accruals, and other accounting instruments they can mold earnings to expectations.
‘The tricks are well-known: A difficult quarter can be made easier by releasing reserves set aside for a rainy day or recognizing revenues before sales are made, while a good quarter is often the time to hide a big ‘restructuring charge’ that would otherwise stand out like a sore thumb.
What is more surprising though is CFOs’ belief that these practices leave a significant mark on companies’ reported profits and losses. When asked about the magnitude of the earnings misrepresentation, the study’s respondents said it was around 10% of earnings per share.’“
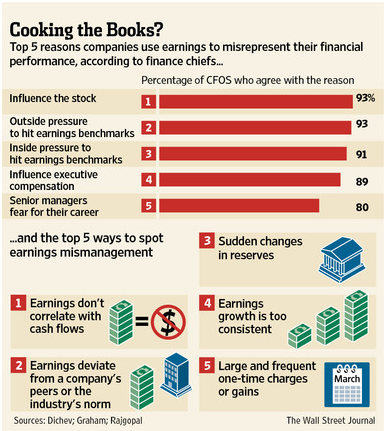
This is also why EBITDA has become an ineffective measure of financial strength. As I noted in “Earnings Lies & Why Munger Says EBITDA is B.S.:”
“As shown in the table, it is not surprising to see that 93% of the respondents pointed to ‘influence on stock price’ and ‘outside pressure’ as the reason for manipulating earnings figures. For fundamental investors, this manipulation of earnings skews valuation analysis particularly with respect to P/E’s, EV/EBITDA, PEG, etc.”
As Charlie Munger once said:
“I think that every time you see the word EBITDA, you should substitute the word ‘bullshit’ earnings.”
Corporate Profits Weaker Than Advertised
Before the recent market rout, the deviation between reported earnings and corporate profits is one of the largest on record. This is an anomaly that should, in reality, not exist.
However, it is worse than it appears.
There is an interesting company included in the calculation of corporate profits, which is not widely recognized in most analysis. If you are an astute follower of our blog, you may recognize this particular company by the size of their balance sheet as shown below.
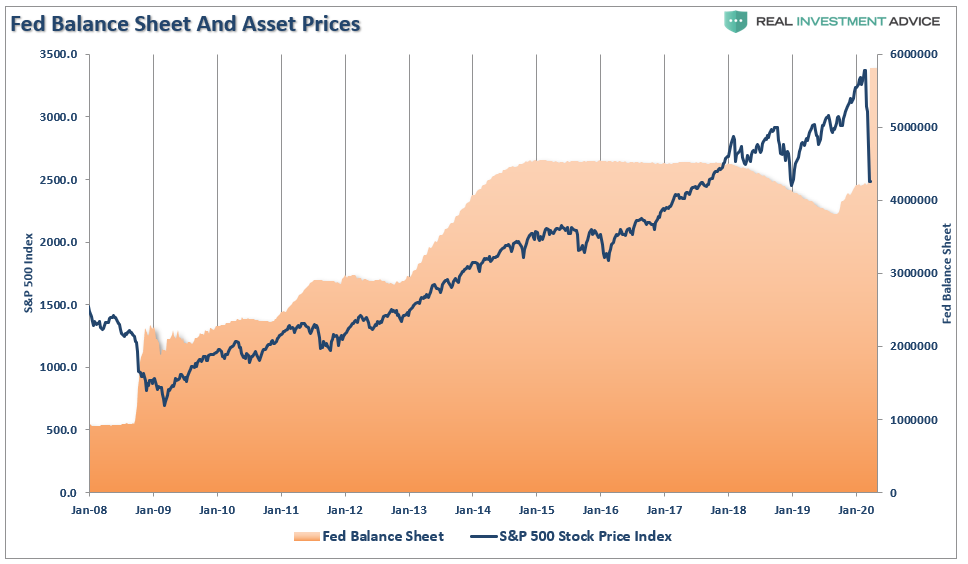
Yes, you guessed it (and it’s in the title). It’s the Federal Reserve.
When the Treasury Department pays interest one the debt, an expense to the U.S. Government, the Federal Reserve takes that in as “profits” which is reported on their balance sheet. Then, at the end of the year, the Fed remits a portion of the “revenue” back to the Government (who also count it as revenue).
These “profits,” which are generated by the Federal Reserve’s balance sheet, are included in the corporate profits discussed here. As shown below, actual corporate profitability is weaker if you extract the Fed’s profits from the analysis.
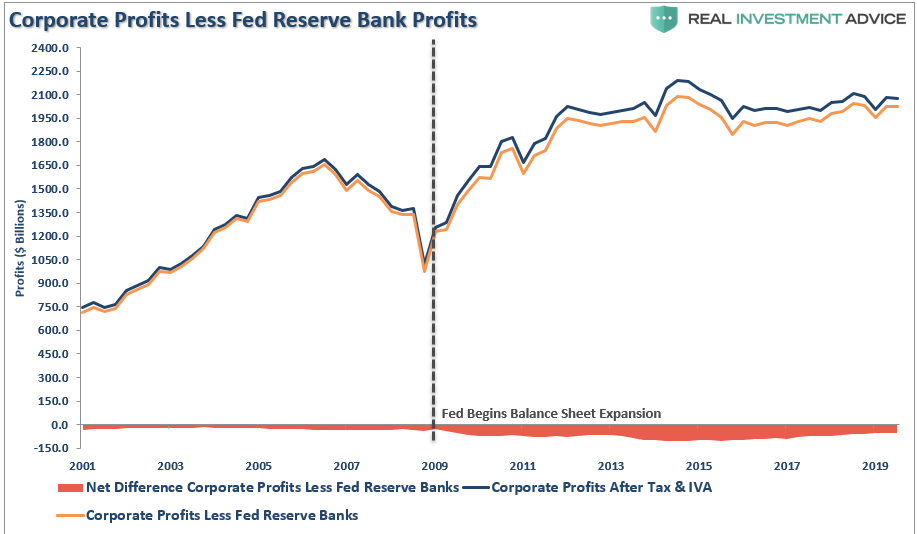
It’s quite amazing, and with the Fed massively increasing their balance sheet, their profitability will expand further.
Nonetheless, since the Fed’s balance sheet is part of the corporate profit calculation, we must include them in our analysis. While the media is focused on record operating profits, reported corporate profits are roughly at the same level as they were in 2011. Yet, the market has been making consistent new highs during that same period.
Estimating The Risk
The detachment of the stock market from underlying profitability guarantees poor future outcomes for investors. But, as has always been the case, the markets can certainly seem to “remain irrational longer than logic would predict,” but it never lasts indefinitely.
“Profit margins are probably the most mean-reverting series in finance, and if profit margins do not mean-revert, then something has gone badly wrong with capitalism. If high profits do not attract competition, there is something wrong with the system, and it is not functioning properly.” – Jeremy Grantham
The impending recession, and consumption freeze, is going to start the mean-reversion process in both corporate profits and earnings. In the following series of charts, I have projected the potential reversion.
The reversion in GAAP earnings is pretty calculable as swings from peaks to troughs have run on a fairly consistent trend. (The last drop off is the estimate to for a recession)
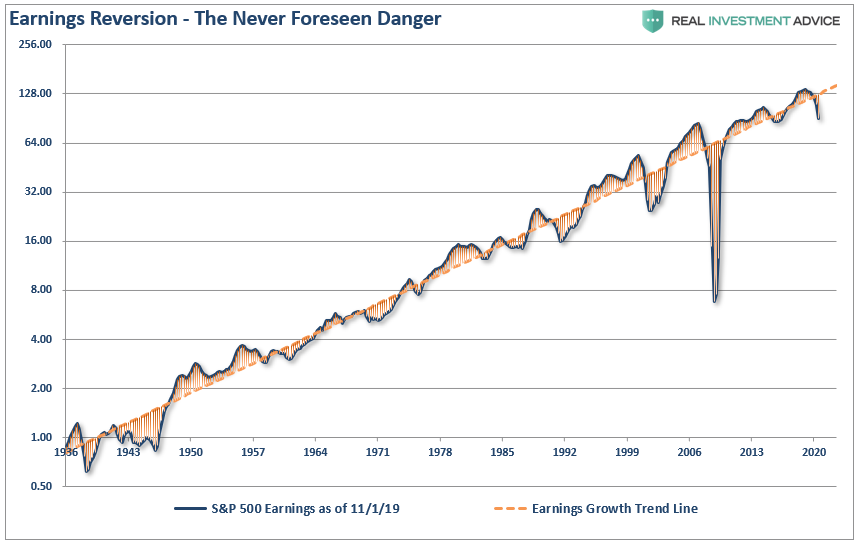
Using that historical context, we can project a recession will reduce earnings to roughly $100/share. The resulting decline asset prices to revert valuations to a level of 18x (still high) trailing earnings would suggest a level of $1800 for the S&P 500 index.
Let me suggest that I am not being “overly dramatic” or “super bearish.” There is a good bit of data to support the thesis. As I noted on Twitter, you can pick your valuation range, and do the math.
S&P Estimates still WAY too high.
Using historical drawdowns in earnings, and peak to trough ranges, earnings will drop to $100/share during the #recession2020 – Pick your valuation target for #SPY bottom.
20x = 2000
18x = 1800
15x = 1500 (Long-Term Avg)
13x = 1300 Undervalued pic.twitter.com/v4inJMdAlj— Lance Roberts (@LanceRoberts) March 15, 2020
Don’t believe me?
We can support that thesis with corporate profits.
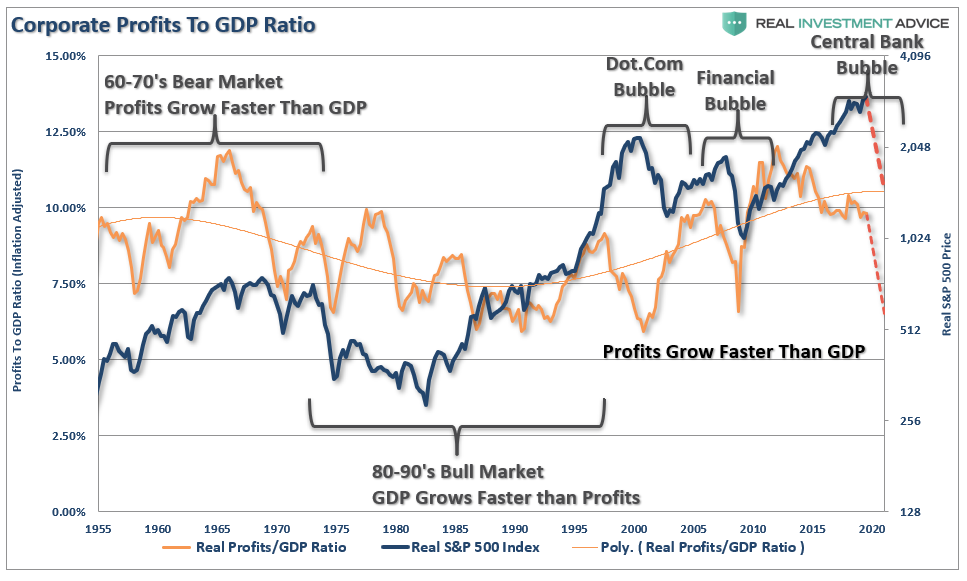
If we look at inflation-adjusted profit margins as a percentage of inflation-adjusted GDP, we see the same process of mean-reverting activity over time. Of course, these mean reverting events are always coupled with recessions, crisis, or bear markets.
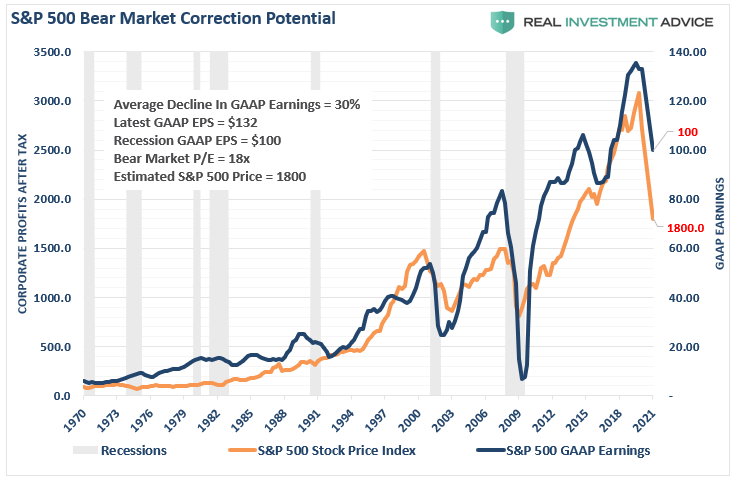
More importantly, corporate profit margins have physical constraints. Out of each dollar of revenue created, there are costs such as infrastructure, R&D, wages, etc. Currently, one of the biggest beneficiaries to expanding profit margins has been the suppression of employment, wage growth, and artificially suppressed interest rates, which have significantly lowered borrowing costs. The oncoming recession will cause a rather marked collapse in corporate profitability as consumption declines.
The chart below shows corporate profits overlaid against the S&P 500 index. As with GAAP Earnings in the chart above, I have projected the potential reversion in corporate profitability as well.
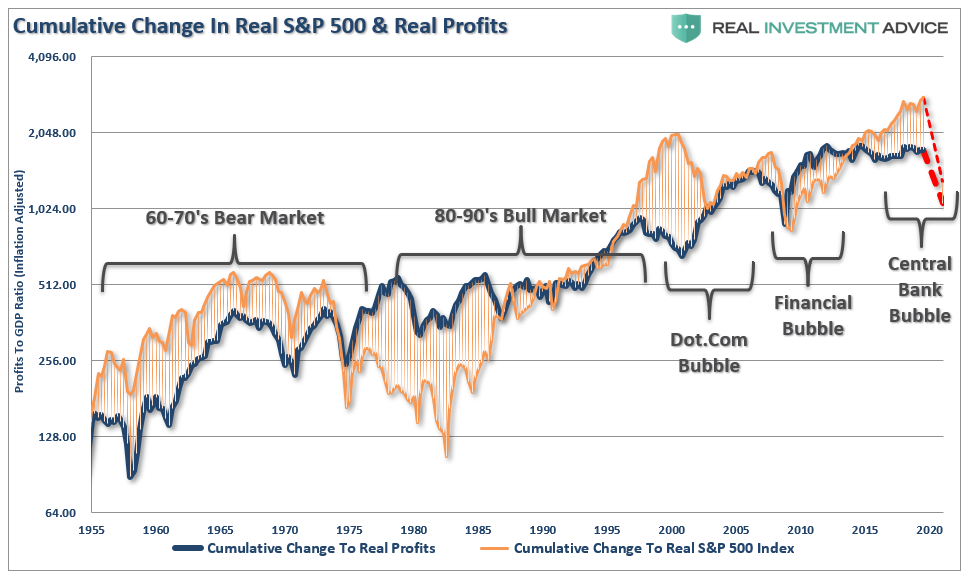
When we measure the cumulative change in the S&P 500 index as compared to the level of profits, we find again that when investors pay more than $1 for a $1 worth of profits, there is an reversal of those excesses
 The correlation is clearer when looking at the market versus the ratio of corporate profits to GDP. Again, since corporate profits are ultimately a function of economic growth, the correlation is not unexpected. Hence, neither should the impending reversion in both series.
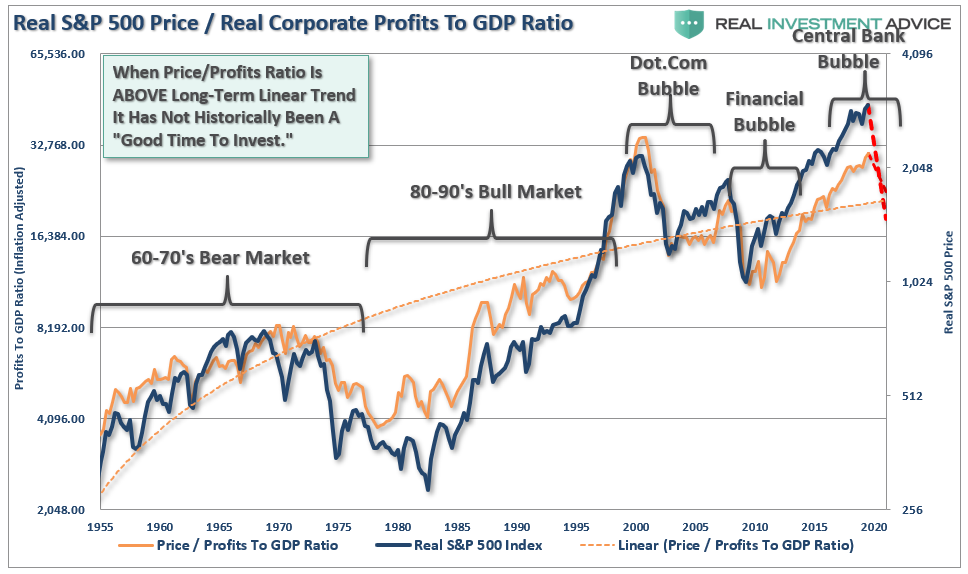
To this point, it has seemed to be a simple formula that as long as the Fed remains active in supporting asset prices, the deviation between fundamentals and fantasy doesn’t matter. It has been a hard point to argue.
However, what has started, and has yet to complete, is the historical “mean reversion” process which has always followed bull markets. This should not be a surprise to anyone, as asset prices eventually reflect the underlying reality of corporate profitability.
Recessions reverse excesses.
Are we at the bottom yet? Probably not, if history is any guide.