via
Nonfarm payrolls are an economic series that is widely followed by the investment community. However, it’s a coincident indicator, meaning it tells you what is going on now, not what might happen in the future. Markets are forward-looking indicators that discount the future. To me, it makes more sense to focus on leading indicators of the economy. Financial indicators, such as interest rates and other reflections of liquidity flows, typically go first. However, in terms of things you can actually touch and feel, housing has consistently been the most leading of all leading economic indicators, due to its interest rate sensitivity.
Housing data, in the form of housing starts ($HSNGSTARTS), has been on an improving trajectory since the beginning of the current cycle in mid-2009. Now, however, we see some indications that the housing recovery may be in trouble. That’s not to say that a recession is just around the corner. At this point, there is not enough evidence to draw such a conclusion. In any case, housing starts can peak-out one or two years ahead of an economic contraction. All I am saying here is that there are several signs pointing to weakness in the housing sector and housing stocks. Incidentally, housing stocks, because they discount a leading area of the economy, also tend to be a leading stock market group, both on the upside and downside.
The connection between lumber and housing starts
Chart 1 features the lumber price in the upper window. Why lumber? Because lumber is a key ingredient going into housing construction. As a result, its price is very much determined by swings in the number of houses being constructed. As you can see, the lumber price was in a trading range between 1993 and 2017. That’s a huge pattern, and that decisive upside break indicated lumber was likely headed significantly higher over the course of many years. Unfortunately, that did not prove to be the case, as the last couple of months have witnessed a sharp reversal into the body of that pattern. This move also pushed the price below its 12-month MA, causing the KST to peak out. The arrows show that previous KST peaks, for this very cyclic commodity, have invariably been associated with a bear market in the price.
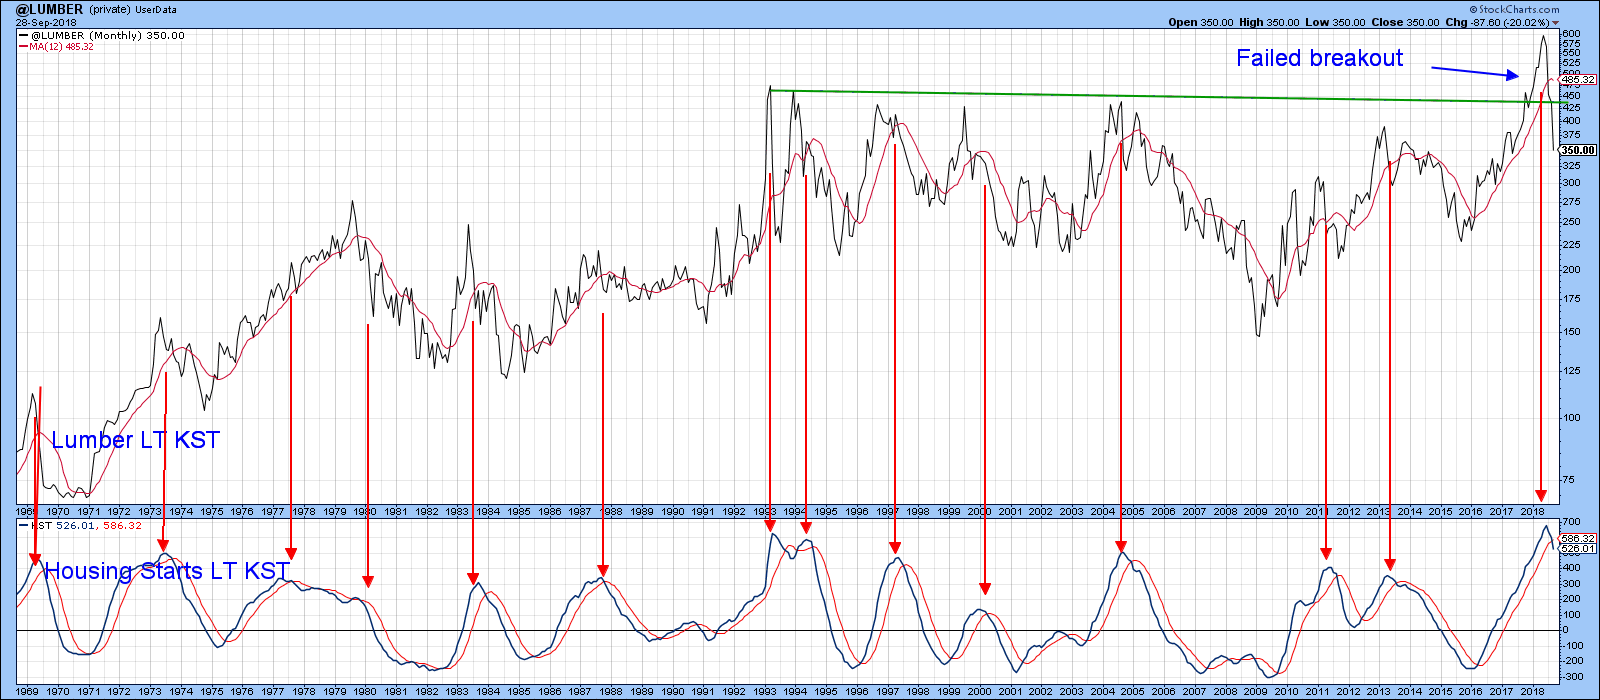 Chart 1
This action not only invalidates the breakout, but has enormous implications for housing starts, in view of the fact that the two are so closely related. You can appreciate that from Chart 2, where the long-term KST for housing starts is also introduced. In the vast majority of situations, the lumber KST leads the housing starts KST, as demonstrated by the right-slanting, downward-pointing arrows. Even where housing starts are leading, the two series rise and fall together. The major exceptions, where falling lumber momentum did not translate into a declining trend of housing start momentum, have been flagged by the gray shaded areas. Housing start momentum peaked in 2013 and has been gently trending lower ever since. It has just triggered another marginal KST sell signal.
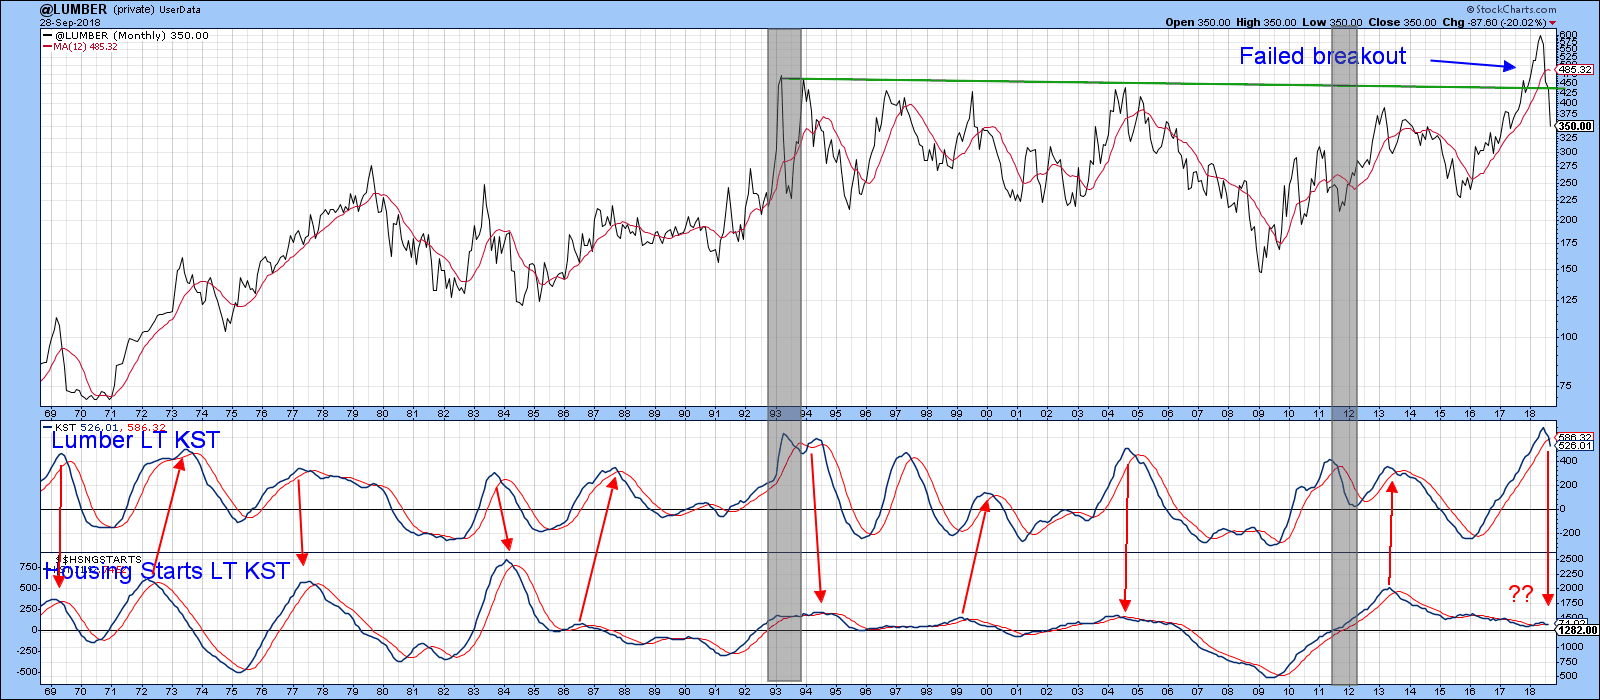 Chart 2
The actual trend, shown in Chart 3, must still be regarded as positive, as the latest 4-month MA (in black) has yet to violate its 24-month MA (Red) and 2014-18 uptrend line. The closeness to a negative signal, though, does not leave much margin for error.
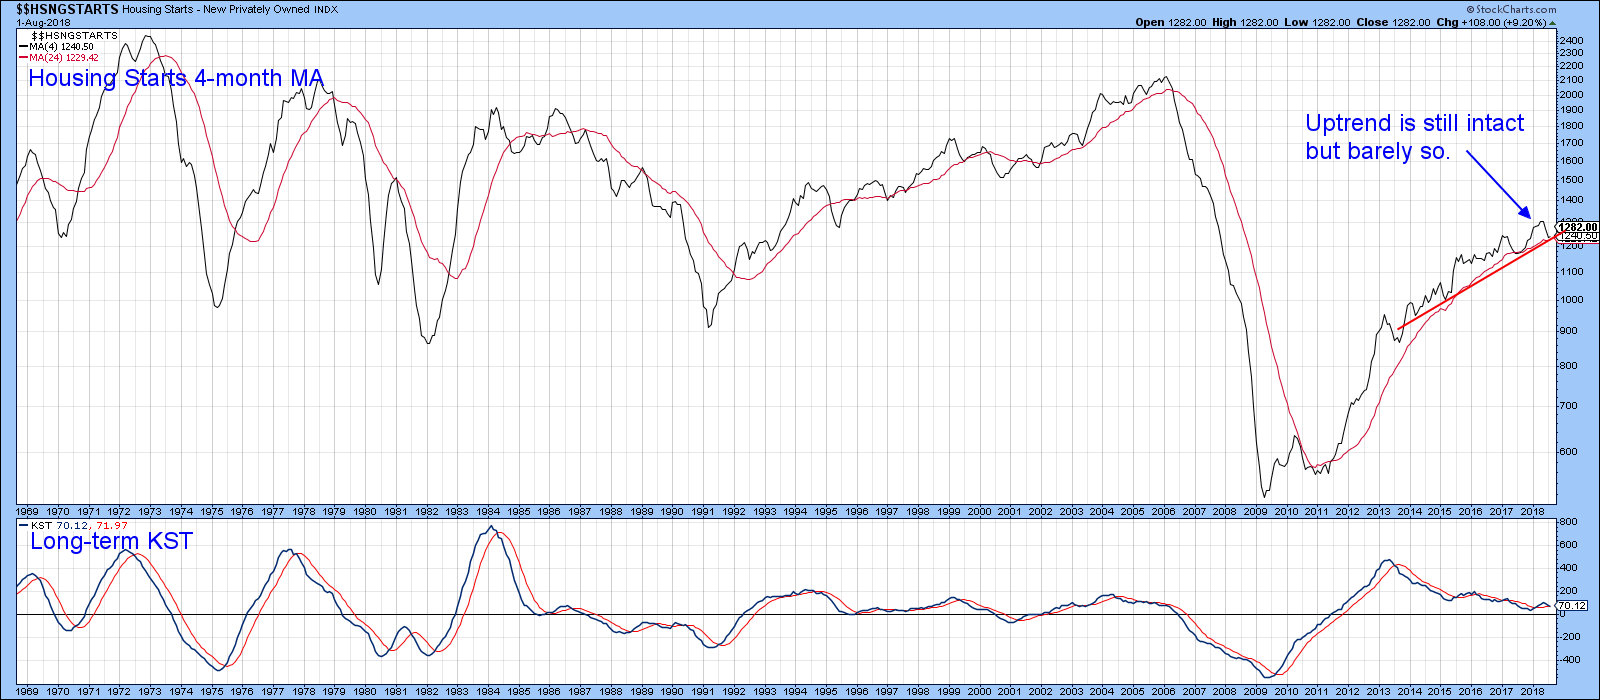 Chart 3
What the homebuilding ETF’s are saying
The homebuilding sector is represented by two principal ETFs: the SPDR S&P Homebuilders (the XHB) and the iShares US Home Construction (the ITB). The XHB is shown in Chart 4 from a longer-term perspective incorporating weekly data. Here, we can see that the price is very close to its 65-week EMA and 2012-18 uptrend line. The bearish long-term KST suggests that a downside break of these benchmarks is more likely than not, as does the fact that the RS line has already dropped below its EMA – and is decisively below what was previously a red support trend line.
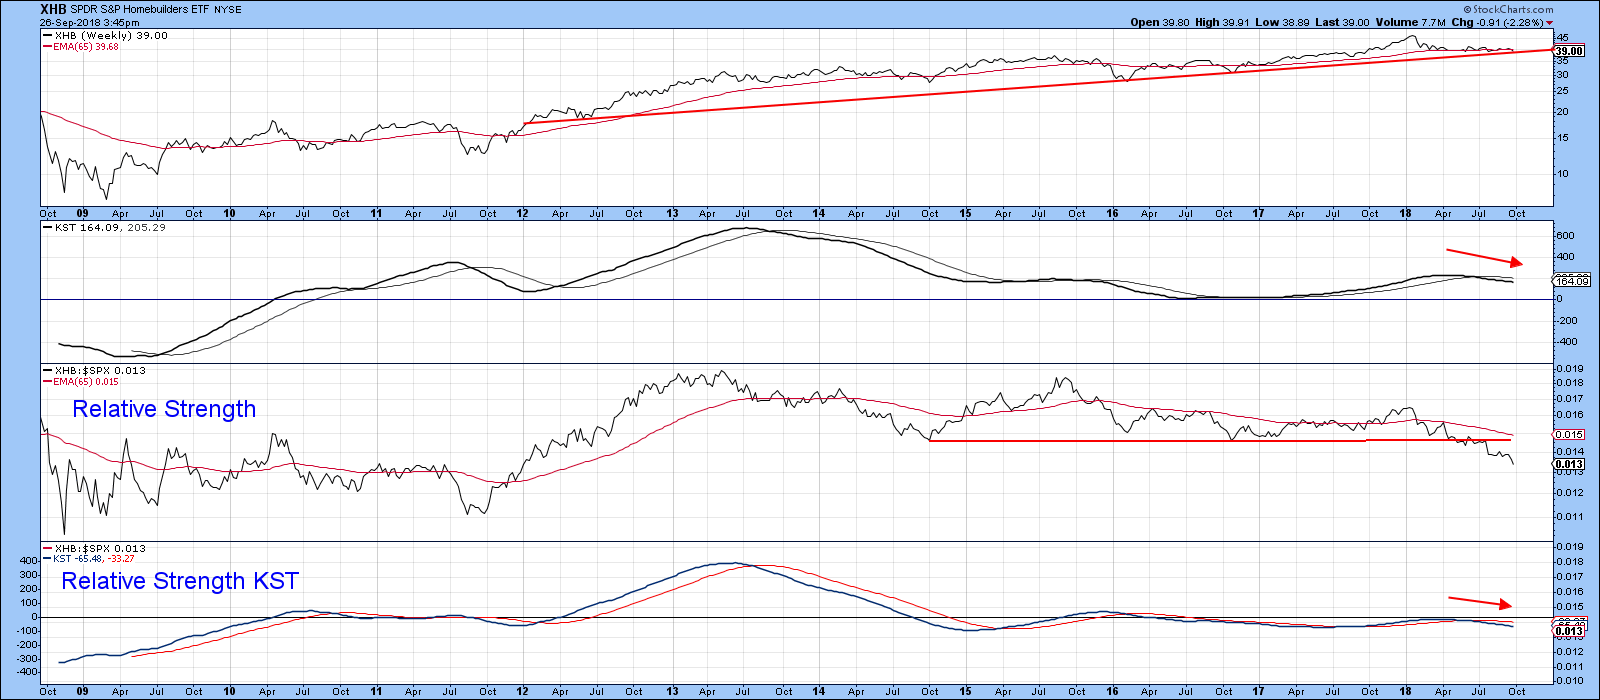 Chart 4
Chart 5 looks at the same indicators as Chart 4, but this time using short-term KSTs and daily data. The top window, featuring the XHB, indicates a bear trend because the price is below its 200-day MA, but the difference between it and a decisive trend line violation is only about a dollar. Both short-term KSTs are in a negative mode.
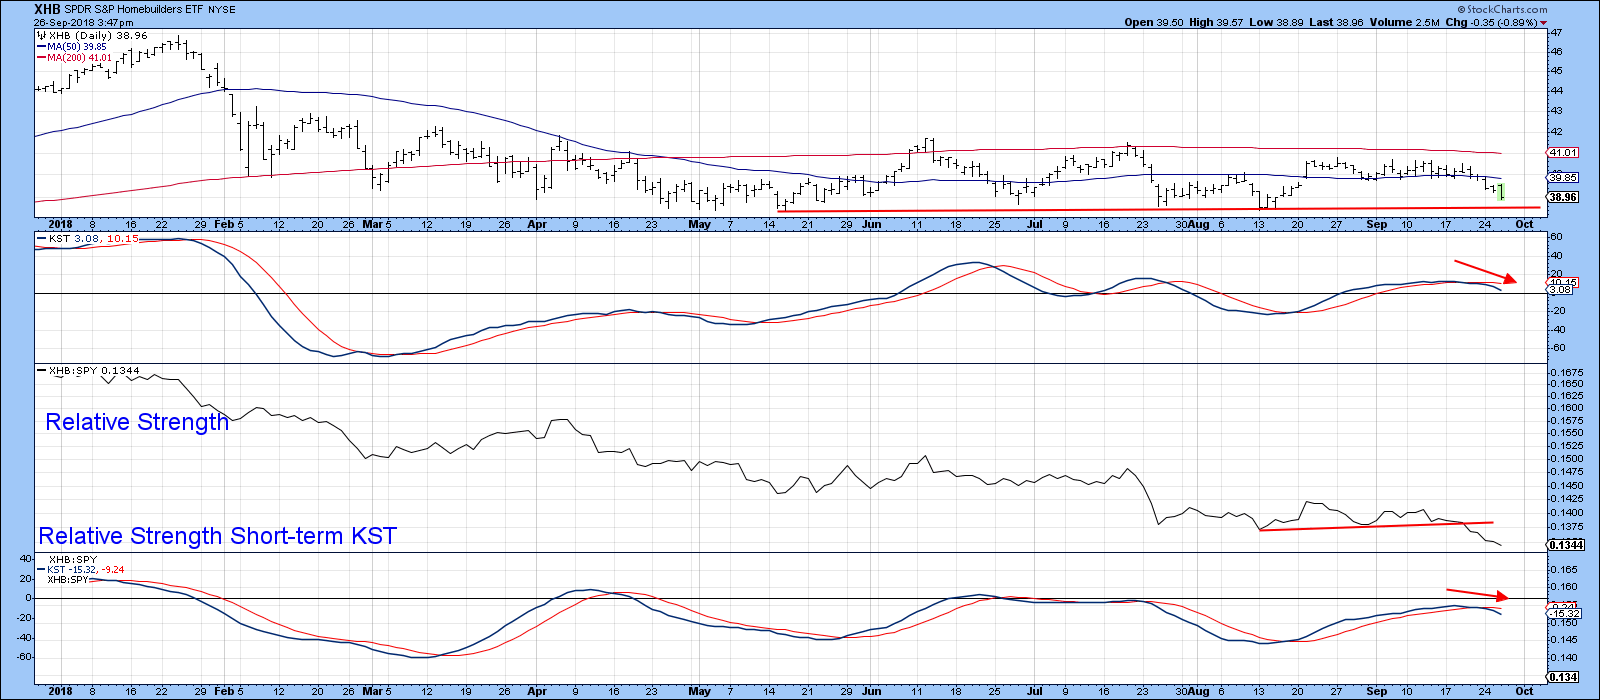 Chart 5
Finally, we can see in Chart 6 that the XHB has already violated its 2016-18 bull market trend line.It may also be in the terminal phase of tracing out a giant head-and-shoulders top. The juncture point worth noting is a daily close below $38.50, since that would take it below the red trend line and the previous low.
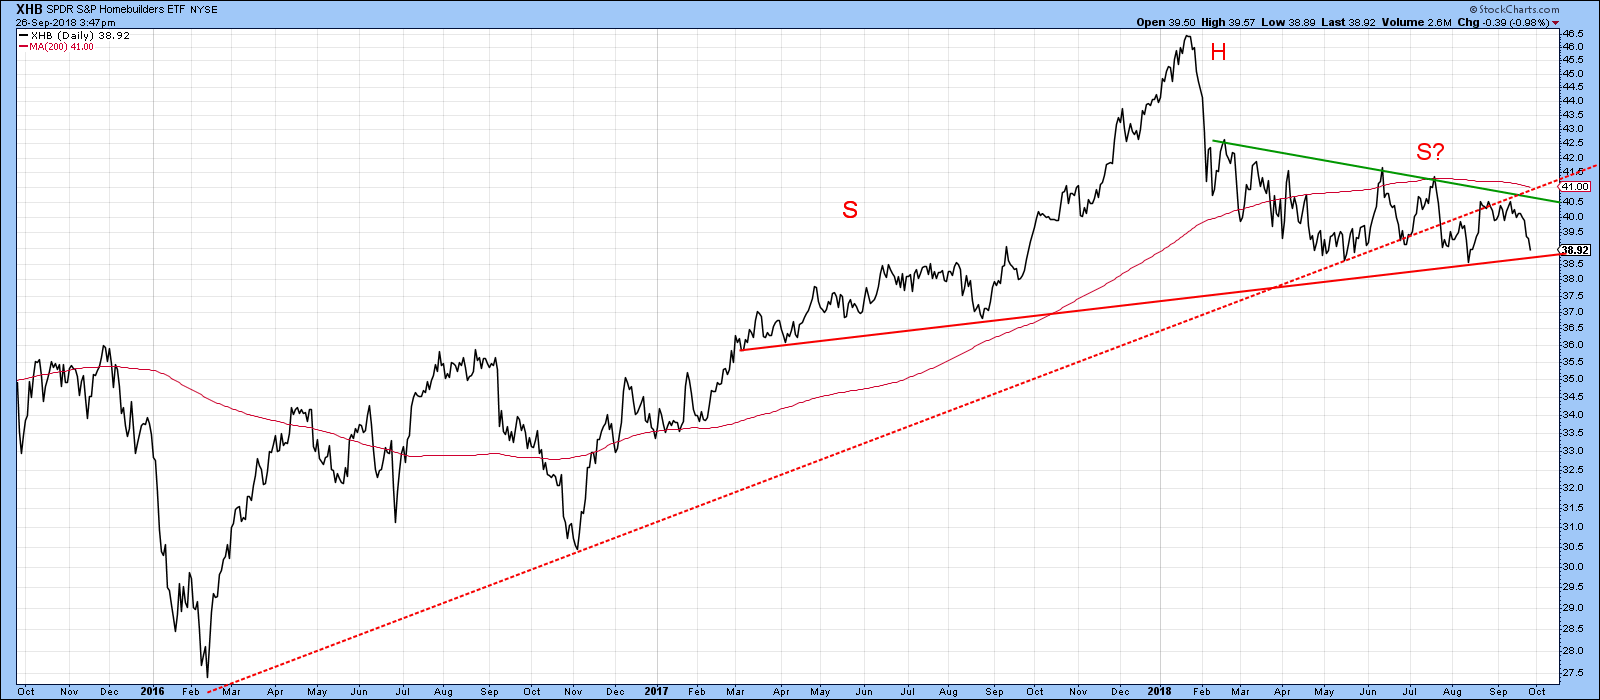 Chart 6
Our last two charts cover the iShares US Home Construction ETF. This is not as much of a pure housing play as the XHB, because it includes some retail oriented construction, such as Home Depot. Nevertheless, Chart 7 shows that the price has violated its bull market trend line on both an absolute and relative basis.
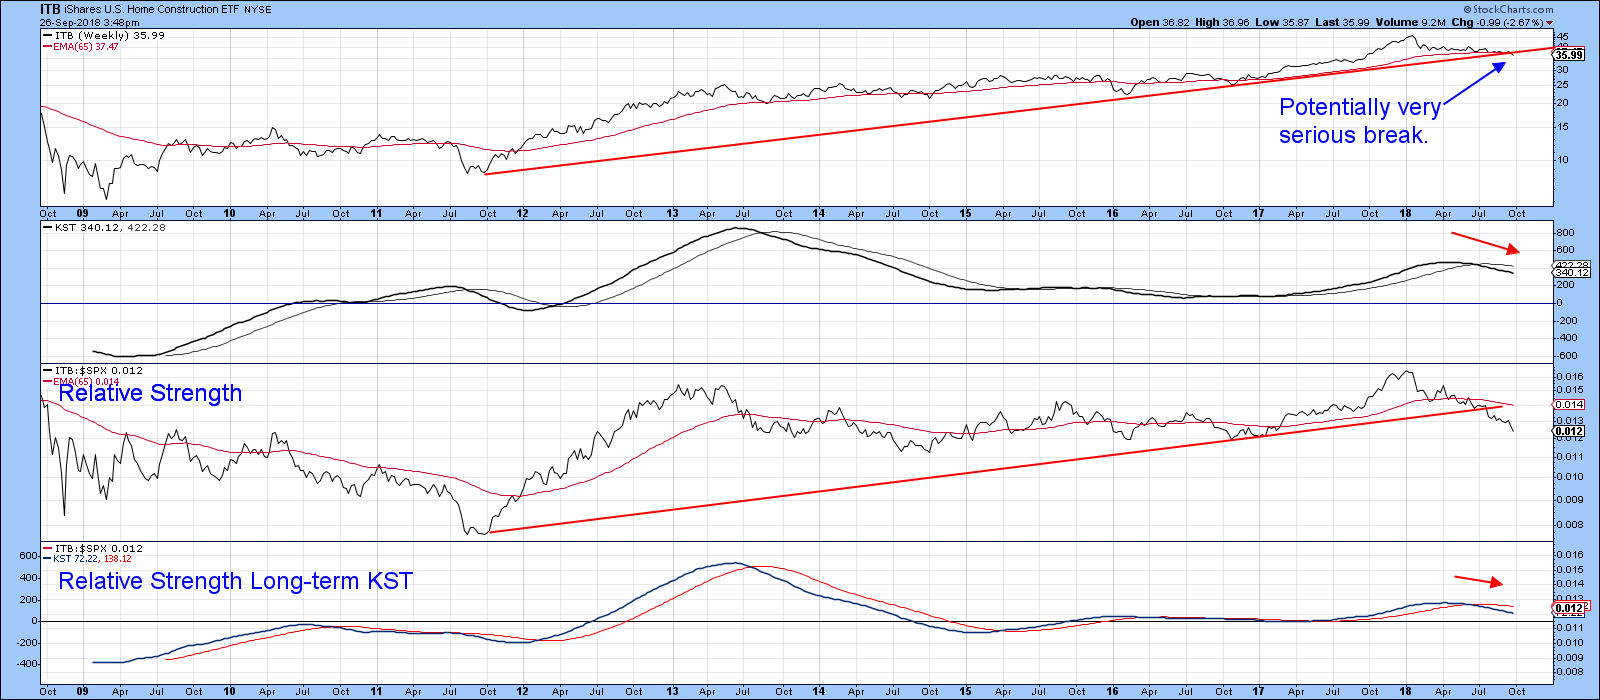 Chart 7
Chart 8 features daily close action, where it is evident that the ITB has completed and broken down from an upward sloping head-and-shoulders. Moreover, it has also violated the Special K uptrend line. For more on the Special K, read here. The two arrows point out the fact that, more often than not, this indicator peaks and troughs pretty similarly to the turning point in the price. The trick, then, is to figure out when the Special K itself has reversed direction. One technique is to wait for a Special K trend line violation to be confirmed by similar action by the price. We see a bullish and bearish example in the chart.
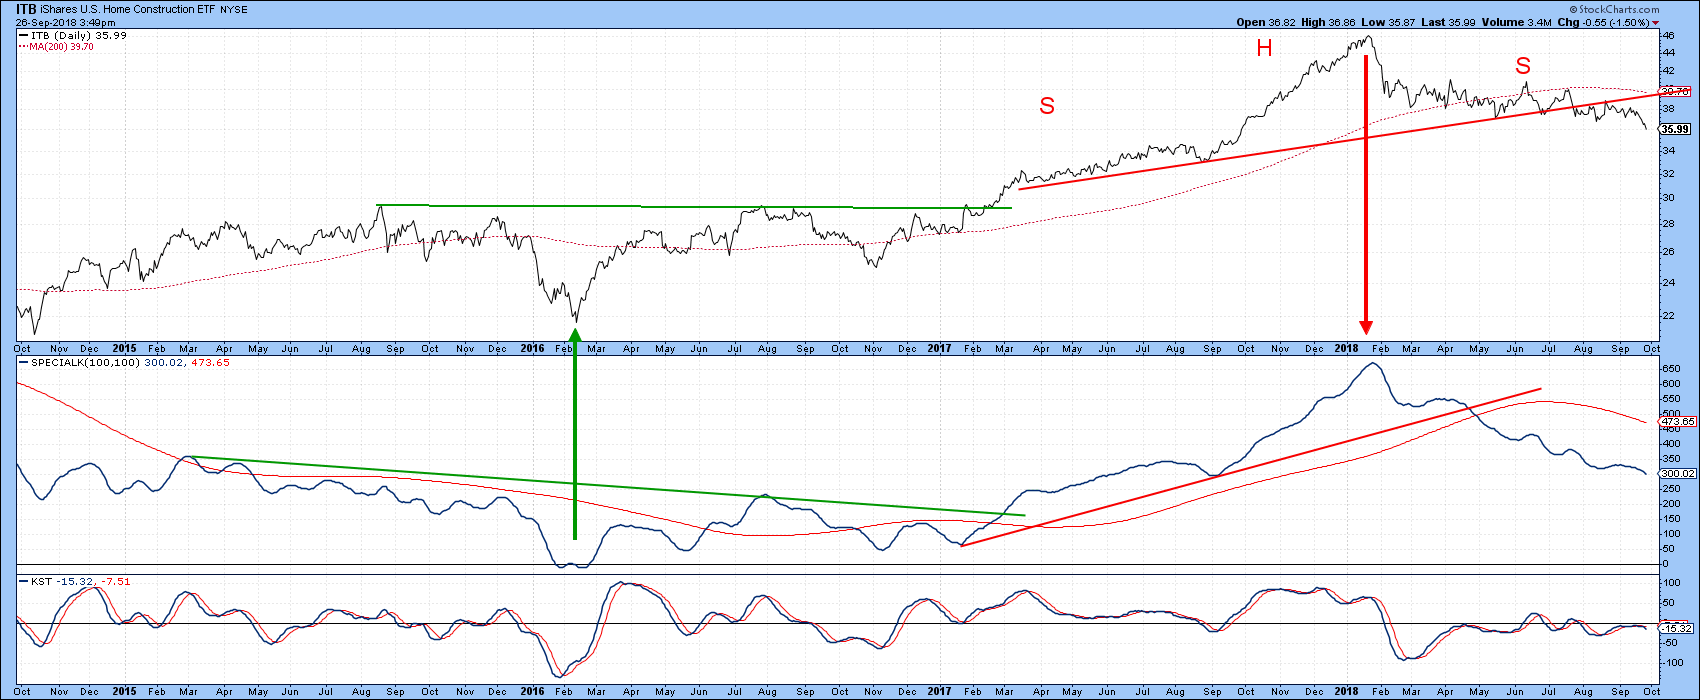 Chart 8
In conclusion, it looks like the lumber price has peaked for the cycle. Where lumber prices go, so do housing starts (typically). A weaker housing industry should spell more trouble ahead for the XHB and ITB.