Wolf Richter wolfstreet.com, http://www.amazon.com/author/wolfrichter
A 39% plunge in three months. But it was spectacular while it lasted.
Previously super-enthusiastic retail investors don’t like what they’ve been seeing in the stock market since January. That’s clear from TD Ameritrade’s Investor Movement Index, which dropped another 12% in March, after having plunged 23% in February, the biggest month-over-month plunge in the history of the index, and after having plunged 9% in January, the largest month-over-month plunge in three years. The January plunge occurred despite the final surge of the stock market rally that took the S&P 500 index to its still standing record close on January 26.
This wholesale collapse of retail investors’ enthusiasm for exposure to the market followed a breath-taking spike that had kicked off at about the time of the election in November 2016. Between that point and the final paroxysm in the stock market on January 26, the S&P 500 surged 35%. Retail investors went all in, and their enthusiasm boiled over, as stocks essentially just rose day after day in one of the least volatile periods in market history. So this is what the breath-taking one-year surge and the even more breath-taking three-month collapse of retail investor bullishness looks like – a near-perfect spike, but a lot steeper on the way down:
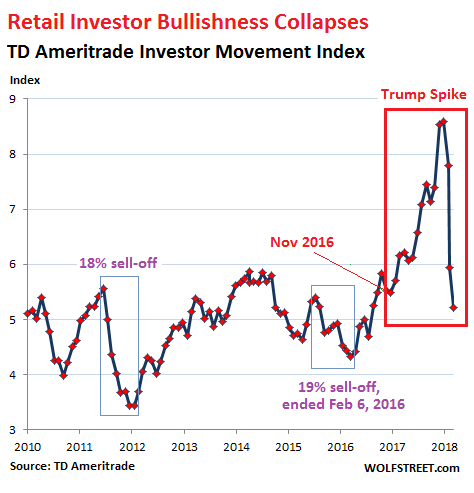
The IMX index also fell sharply during the past two sell-offs, the 18% slide in the S&P 500 in 2011-2012 and the 19% slide that ended in February 2016 – but nothing like the collapse of the phenomenal Trump spike.
The index, which tracks clients’ actual trading activities, is not based on what investors say they feel or plan on doing. It’s based on what they’ve actually done in their accounts and how they’re positioned in the markets. Unfortunately, there is no data for the period before and during the Financial Crisis.
And in just three months, the index has plunged from the stratosphere back to the level that TD Ameritrade considers “moderately low” – the lowest level since August 2016.
“Market volatility was once again prevalent during the March IMX period,” the report said, adding:
The market selloff continued during the period, with all three major U.S. Equity Indices moving lower. The S&P 500 and NASDAQ Composite Index both decreased more than 3.5%, while the Dow Jones Industrial Average was down 4.8%. Volatility was widespread near the end of March, with the technology-heavy NASDAQ moving in excess of +/-2% in four of the final six trading days, sparked by fear about whether the technology industry could face heavier regulation after Facebook’s handling of user data.
After the relentless one-year 35% surge of the S&P 500 index during the Trump spike, a return to normal-ish market swings, but with a downward bias, was very unwelcome, and retail investors took some more risk off the table. But they were not exactly massively fleeing the market for safe havens such as gold and silver, it seems….
TD Ameritrade’s Chief Market Strategist, JJ Kinahan said in an interview that clients were “still slightly net buyers” in March, “however the exposure they’re willing to take is down for the third month in a row. In fact, it’s down to the lowest level we’ve seen in two years.”
“What it really means is they’re buying lower beta stocks (less volatile compared to the market) and selling any of the stuff that was higher beta (more volatile compared to the market),” he said. “And one of the big stocks they sold, which was a surprise to me that they sold it so heavily, was Facebook,” which was down 25% from its all-time highs, he said. “It was one of our top three held stocks.”
Clients sold the stocks that had “nice runs” in order to “regroup,” he said.
Whether this index is a leading indicator for the direction of the stock market (which it was in January and February), or a coincident indicator, or a lagging indicator, one thing is certain: After the election, retail investors bought whole-hog into the theory of the “Trump bump” in the market – and this includes, ironically, a lot of retail investors who were otherwise furious with the election outcome. Too bad for the market that this exponential “Trump spike” in retail investor bullishness suddenly and totally collapsed.
Meanwhile, whatever the markets are doing, businesses are now grappling with the end of the “credit cycle,” and new Chapter 11 bankruptcies spiked 63% from a year ago to the highest number of filings since April 2011. Read… Chap. 11 Bankruptcies Spike 63% from Year Ago