Wolf Richter wolfstreet.com, http://www.amazon.com/author/wolfrichter
It’s called “Housing Crisis” for a reason.
When we discuss the insane San Francisco housing market, it’s usually in terms of median asking rents ($4,680 a month for a 2-bedroom), the median single-family house price ($1.7 million), the median condo price ($1.2 million), or the Case-Shiller Home Price Index’s 11% year-over-year surge. As different as the data may be, all of the data agrees: San Francisco is a horrendously expensive place to live. But beneath the summary data hides the complexity of a housing market that is now commonly called the “San Francisco Housing Crisis.”
So for the first time, and to get a better grip on the issues, the SF Planning Commission has prepared a “Housing Needs and Trends Report,” or HNTR (12-page executive summary; 88-page full report). The report “represents more than a year’s worth of effort by both Planning staff and consultants to gather and analyze data,” it says. So here are some Key findings:
San Francisco is a city of renters:
65% of the homes are renter occupied; only 35% of the homes are owner occupied.
Over 60% of all rental units are in “rent controlled” buildings. In SF, rent control only applies to older multi-family buildings. It does not apply to buildings completed after June 13, 1979, and it does not apply to condos and single-family homes that are rented out. In other words, none of the newer housing stock is rent-controlled. Rent control in SF means that when the unit comes on the market, it is rented out at market rent, but annual rent increases from that point on are limited based on a measure of inflation.
Even rent-controlled units are becoming less affordable: of the 160,000 rent-controlled units in 2015, about 100,000 units were rented at rates that would be affordable to households earning less than 80% of the Area Median Income (AMI), down from 140,000 in 1990.
A household of two that earns less than 80% of AMI, according to the Mayor’s Office of Housing and Community Development, currently makes $75,750 or less a year.
The Planning Commission’s report pointed out:
Units rented in the previous 2 years, show the erosion of affordability of the city’s rent-controlled stock. Whereas in 1990 a substantial majority of all recently rented rent-controlled units were rented at rates affordable to lower income households, by 2015, only 10,000 such available units were affordable to those households.
9% of households live in about 33,000 affordable housing units, where rents and sale prices are set so that they’re deemed to be affordable at low and moderate-income levels by SF standards.
San Francisco’s growing density:
- Buildings with more than 5 units account for 52% of the city’s housing units but occupy only 19% of its land area.
- Single-family homes account for 27% of the housing units but occupy 62% of its land area.
Not lack of supply, but lack of affordable supply:
In 2017, thanks to the construction boom, new construction created about 4,500 new housing units; in 2016, new construction created over 5,000 new housing units; this is way more than double the historical average since 1990 of 1,900 units per year. Practically of them were multi-family buildings.
But of those units built since 1990, 28% are deemed to have been “affordable to low and moderate-income households.”
Cost has an impact on who lives in San Francisco
High costs attract high-income households; lower-income households are leaving:
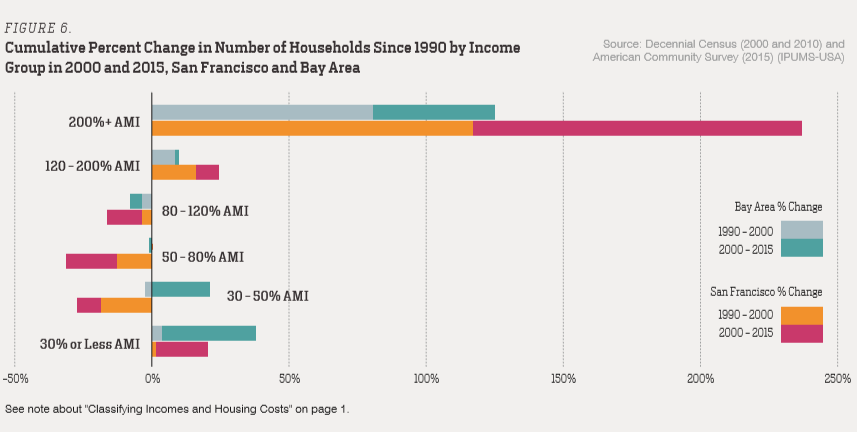
The number of households earning more than 120% of AMI (for a household of 2 = $113,650) tripled since 1990. And of them, 82% are now high-income households earning 200% or more of AMI (for a household of 2 = $189,400).
The number of “low and moderate-income” households earning less than 120% of AMI (for household of 2 = less than $113,650) dropped more in San Francisco than in the region. “This change may be due to households increasing their earnings or it may be because more of these households have left the city, or a combination of both.”
The number of workers who work and live in SF has reached an all-time high of nearly 500,000.
The majority of the increase in workers in SF has been driven by workers earning more than $100,000 per year – individual workers, not households. “However, workers” – not households – “earning less than $75,000 continue to be the majority of workers in San Francisco.”
But with two of those $75,000-a-year earners into one households, the household makes $150,000.
The number of high-income workers earning 200% or more of AMI has surged by 240% since 1990 with over half of that increase coming since 2000. At the same time, workers earning less than 120% of AMI – an individual worker making less than $99,500 – are leaving. In the chart below, note the increase of workers making 30% of AMI ($24,850). Would that be students? (Click to enlarge).
The report finds that “housing cost burden has increased for renters and owners of all income groups, but very low-income households [less than 50% of AMI, or less than $47,350 for a household of 2] experienced large increases in severe cost burden since 1990. Above-moderate income households now face rent burden, which they did not in 1990.”
Households earning less than 50% of AMI ($47,350 for a household of 2) face a situation where housing costs consume 50% or more of income.
The way people make do in SF is by living together:
“San Francisco exceeded the region in the rate of growth for couple households (without children or other family members) and roommate households,” the report said. “These households are also more likely to be higher income as they are able to combine incomes from multiple working household members.”
This is why San Francisco is a place where people with relatively high incomes can feel squeezed. Earning less than 120% of AMI for an individual worker, thus earning less than $91,200 a year,