
- Selloff Overdone, Looking For A Sellable Rally
- Sector & Market Analysis
- 401k Plan Manager
Follow Us On: Twitter, Facebook, Linked-In, Sound Cloud,Seeking Alpha
Selloff Overdone, Looking For A Sellable Rally
On Friday morning, we posted the following commentary for our RIA PRO subscribers:
“In a surprising move Thursday night, Donald Trump slapped Mexico with a 5 percent tariff on all goods and set in place a schedule to ratchet it up to 25% over the next four months. The new tariffs are not in retaliation for trade, but a punishment designed to get Mexico to halt illegal immigration into the U.S. The dollar index is relatively flat, but the Mexican peso is down 3 percent versus the dollar, and bond yields have declined by 5-6 percent.
Mexico is the United States third largest trade partner not far behind China and Canada. To put further context on the amount of trade between the U.S. and Mexico, the combined trade of Japan, Germany, and South Korea with the U.S. is less than that with Mexico.
Corporate Profits, reported by the BEA yesterday, fell from +11.2 percent annual growth in the fourth quarter to 1.6 percent annual growth in the first quarter. As we have seen with earnings being reported from individual companies, the growth benefits of the tax reform bill have largely run their course. Profits will remain higher due to lower taxes, but we will no longer see profit growth due to the bill.”
There are two incredibly important points in that commentary:
- Since the beginning of this year, the markets were rallying based on a trade resolution. Instead, the markets were hit by an “Orange Swan” of an accelerated trade war.
- Corporate profits are slipping back to growth rates equivalent to economic growth. As we noted in January of 2018, tax cuts are temporary and the benefit lasts for one year until since we compare earnings growth on a year-over-year basis.
The current correction shouldn’t be a surprise though as we have been warning about it since the beginning of May.
This week we are going to look at the recent sell-off and the potential for a short-term “sellable” rally to rebalance portfolio risks into.
Three Weeks Ago
In order to understand our positioning, we have to go back to the beginning of May when we discussed taking profits and reducing risk. To wit:
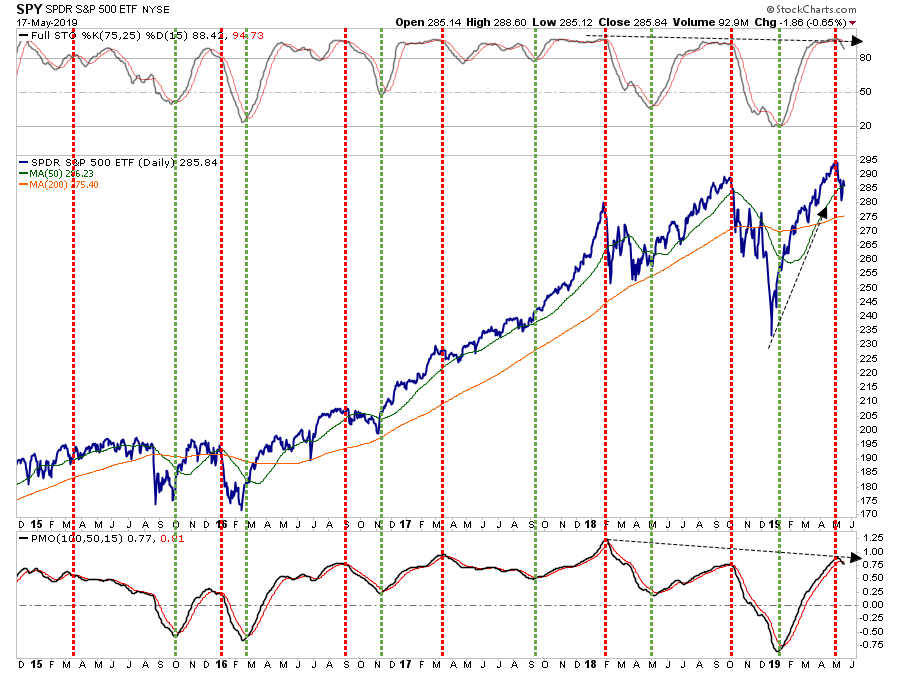
“While that break to the upside was indeed bullish, the market remains very confined to a rising consolidation pattern and failed to close above the intraday all-time highs from last September. With the markets trading on VERY light volume on Friday, combined short-term ‘sell signals’ forming, and pushing more extreme overbought conditions, it is too early to completely remove all risk management controls in portfolios.”
I also noted the extreme deviation above the long-term mead which suggested a mean-reverting event was likely.
“Currently, the markets have had a stellar run since the beginning of the year, and as we wrote previously if you sold everything today, and went to cash, it is unlikely you will miss much between now and the end of the year. (We aren’t recommending you do that, it is just to illustrate a point)
In ‘A Warning About Chasing This Bull Market.’ I wrote ‘at almost 7% above the long-term weekly moving average, the market is currently pushing the upper end of historical deviations.’”
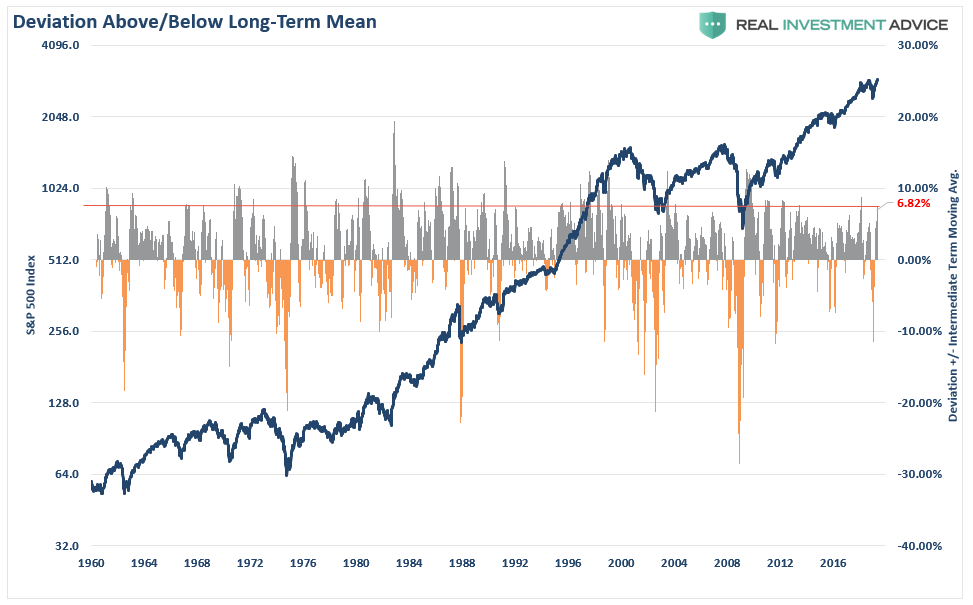
The important point to take away from this data is that ‘mean reverting’ events are commonplace within the context of annual market movements.

Since we publish our model changes in real-time for our RIA PRO subscribers. (Try NOW and get 30-days FREE) they were told of the changes we made to portfolios at that time.
“Over the last couple of weeks, we have been discussing the incessant rise in the market and the need to trim profits and rebalance risk in some of our holdings particularly after such large gains in some of the positions since the beginning of the year. Some of the proceeds we took we then added to Health care due to the valuation opportunity that exists currently.
- Sold 20% of AAPL @ 200.5446
- Added to ABT @ 78.6536
- Sold 10% of CMCSA @ 43.378
- Sold 10% of COST @ 244.3952
- Sold 10% of DOV @ 97.254
- Sold 10% of YUM @ 103.97
- Added to HCA @ 128.49
- Sold 10% of MDLZ @ 50.545
- Sold 10% of PG @ 105.635
- Sold 10% of MSFT @ 130.205
- Sold 10% of NSC @ 201.4858
- Added to UNH @ 236.6287
- Sold 10% of UTX @ 141.755
- Sold 10% of V @ 165.4572
- Sold 10% of VMC @ 125.3312“
Notice that when we suggested taking profits and reducing risks, we didn’t SELL EVERYTHING and go to cash. That is not the way to properly manage a portfolio built for long-term capital appreciation. We did reduce risk by taking profits from extremely extended positions and rebalanced risks by rotating into more defensive holdings. (I published an investing resource for you previously: 10 Illustrated Truths About Investing & The Markets)
The following week, in “Game Of Thrones” we pointed out the message sent by the Summation Index:
“We still maintain a long-bias towards equity risk. But, that exposure is hedged with cash and bonds which remain at elevated levels. As shown below, The summation index has turned lower which typically precedes correction periods in the market. This doesn’t mean the markets will ‘crash,’ but does suggest downward pressure on asset prices in the near term. (It also doesn’t mean stocks won’t bounce while working their way lower either.)”
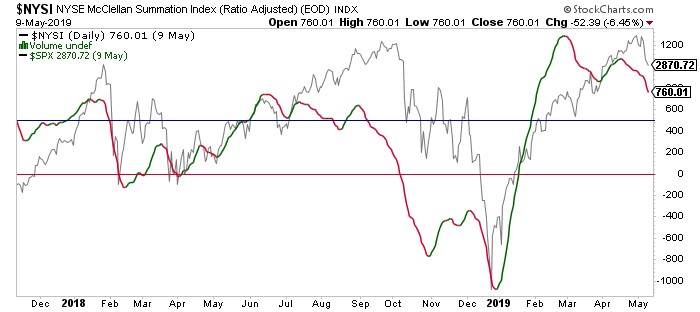
“’Momentum’ driven markets are ‘fickle beasts’ and will turn on you when you least expect it.”
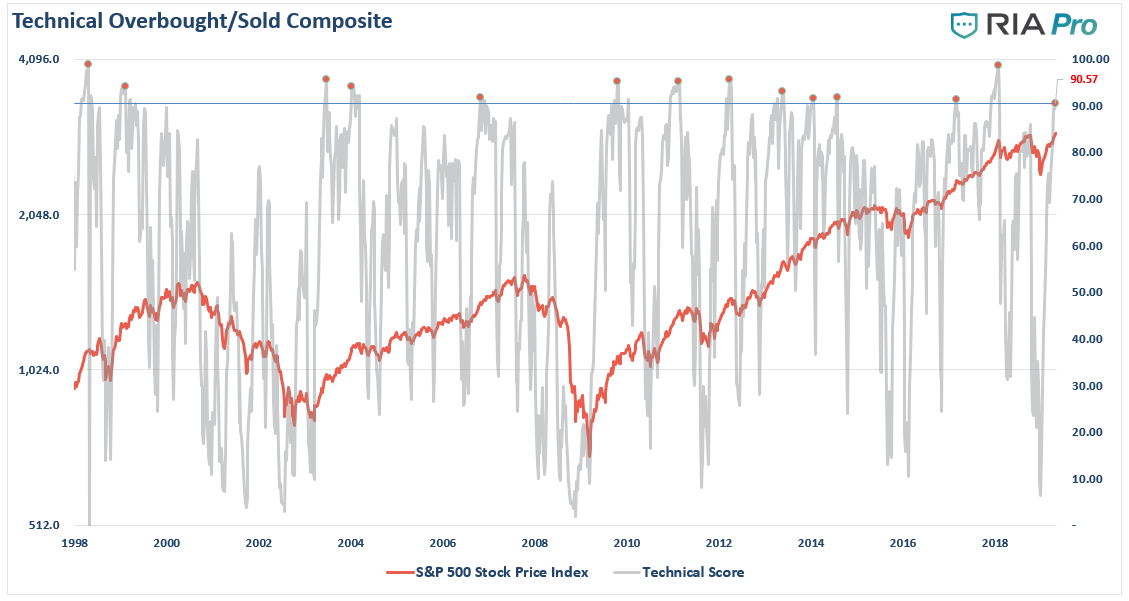
In that same missive we also pointed out the extreme technical extensions in the market as represented by our composite technical indicator.
“Stock market positioning was excessively bullish with record long stock exposure combined with record shorts on the volatility index and our technical composite index back near record levels (shown below).”

Two Weeks Ago
Of course, as Trump ramped up the “trade war” rhetoric, the repricing of risk in equities became more prevalent. By the following week, when we published “The Bulls Are Betting On A Long Shot,” the correction we had predicted was in full swing,.
“For now, the market is working a corrective process which is likely not complete as of yet. As we head into the summer months, it is likely the markets will experience a retracement of the rally during the first quarter of this year. As shown in a chart we use for position management (sizing, profit taking, sells) the market has just issued a signal suggesting risk reduction is prudent. (This doesn’t mean sell everything and go to cash.)”
Last Week
This, of course, bring us to last weeks missive.
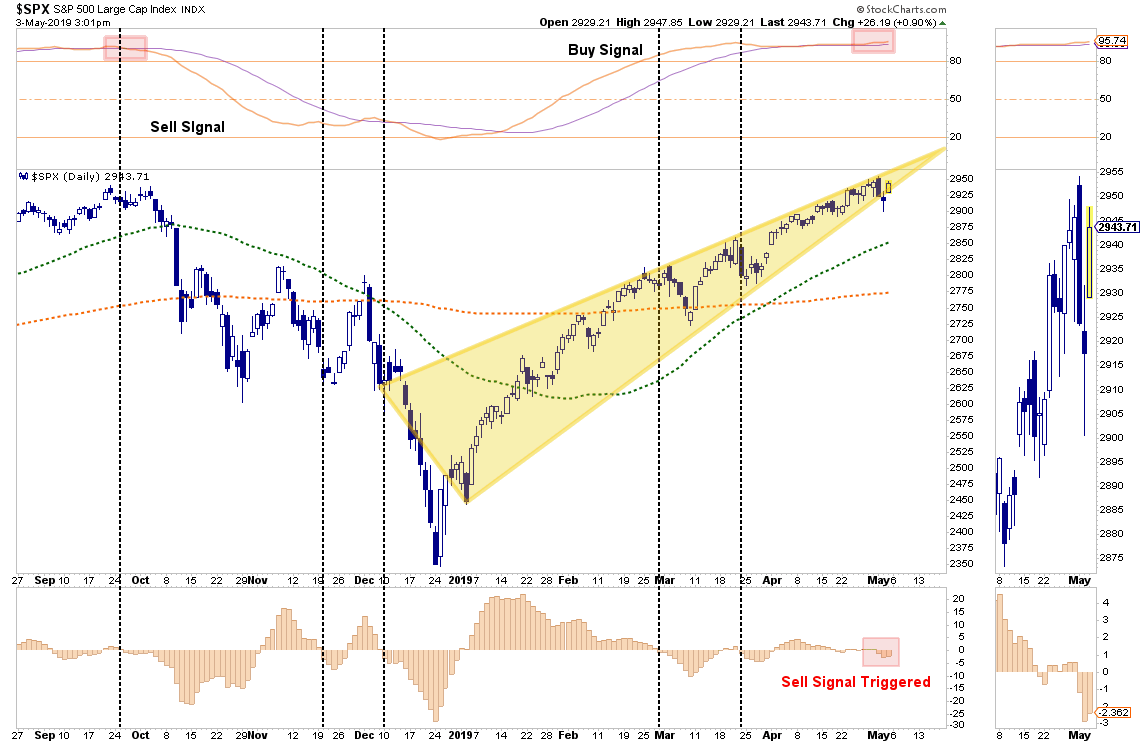
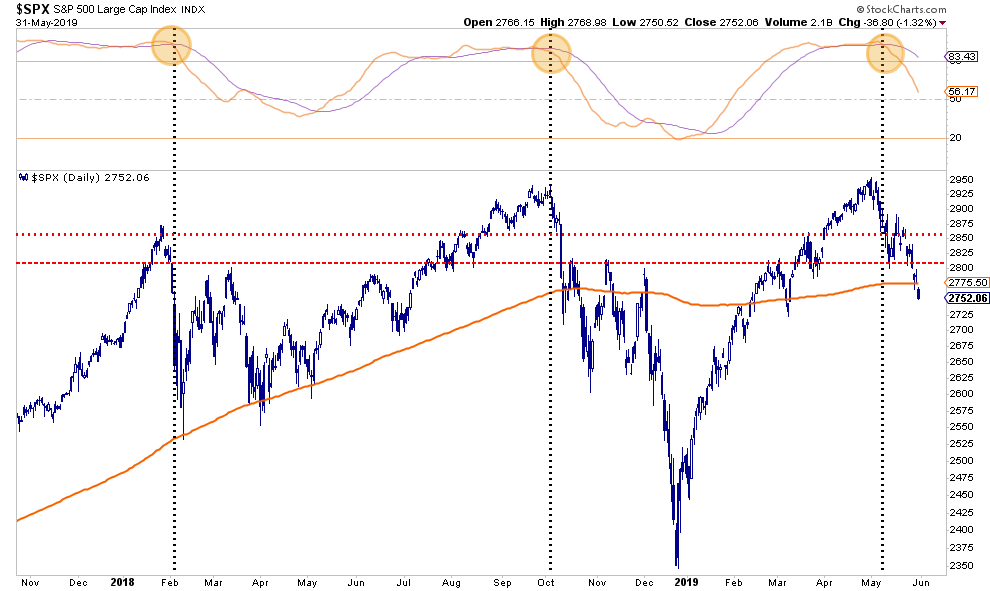
“Currently, on a very short-term basis, the markets have worked off some of the overbought condition from last month and, importantly, has held support at the Oct-Nov 2018 highs. There is additional support at the 200-dma just below current support at 2775. These are key support levels for the S&P 500 as we head into the summer months and, if the bulls are going to maintain their stance, must hold.”
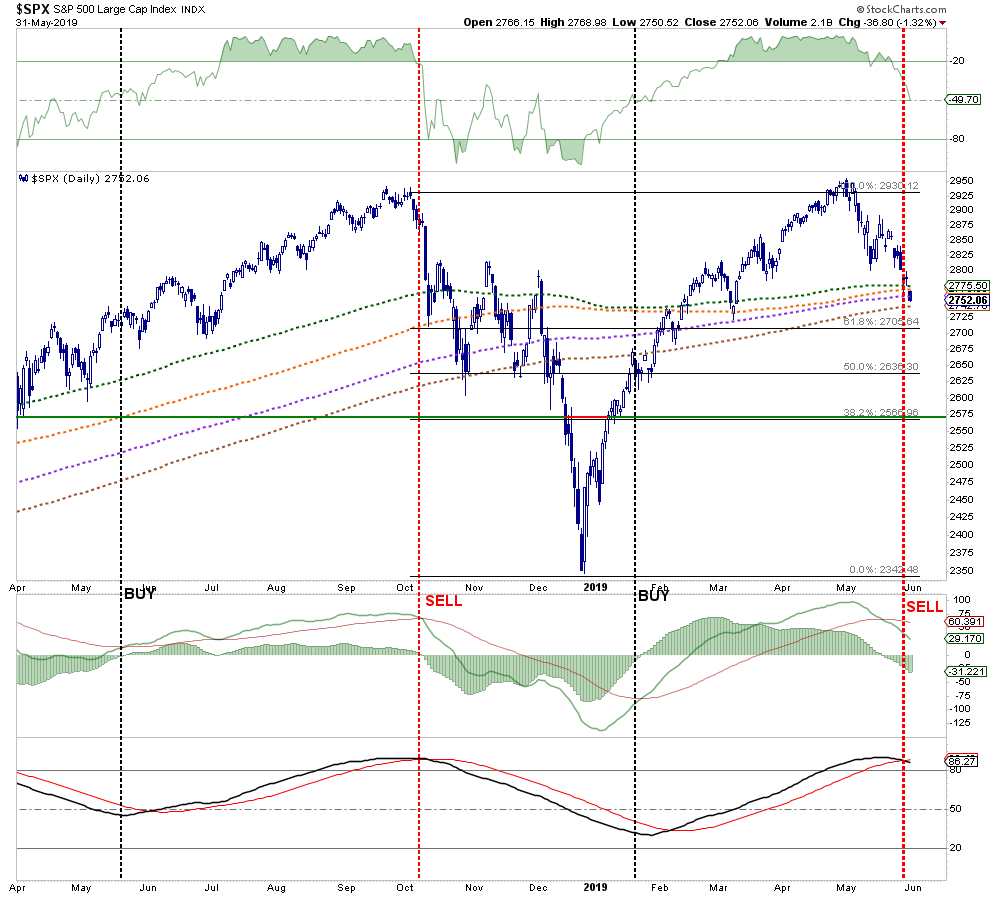
I have updated last week’s chart through Friday’s close:
“The reason we maintain a more defensive posture is the triggering of the intermediate-term “sell signal” (yellow highlights above) suggest that prices will remain under pressure for a while longer. (Hence the rotation to defensive positioning.)”
Let me reiterate four very crucial points the markets have NOT factored in just yet:
- There will be NO TRADE DEAL any time soon. (China is buckling down for a long fight.) Read This
- Earnings estimates are still far too high going into the end of 2019 and 2020. Read This
- The economy will weaken further as the latest rounds of tariffs, which take effect June 1st, begin to impact the economy headed into the last half of 2019. Read This
- The Fed is unlikely to lower rates, or increase their balance sheet, prior to a recessionary start or a substantially deep correction in the market. (i.e. more than 20% from current levels) Read This
However, let’s look at it another way. Let’s take the “bullish” arguments for a moment:
- Employment is the strongest in 30-years
- Corporate profits are strong
- GDP growth just came in at 3.1% for the first quarter
- Consumer confidence is near all-time highs.
- Jobless claims are the lowest in 40-years.
- There are more job openings than people available to fill them.
- The stock market is just a couple of percentage points off their all-time highs.
This certainly isn’t the backdrop in which the Fed would, or should, cut rates. The is particularly the case when their balance sheet remains near $4 Trillion and monetary policy tools will have a more muted effect in the future.
In other words, the Fed likely going to waste their “silver bullet” until the last possible moment. That moment will require a more pressing issue like a credit-related event, rather than just a 20% decline in asset prices.

This Week
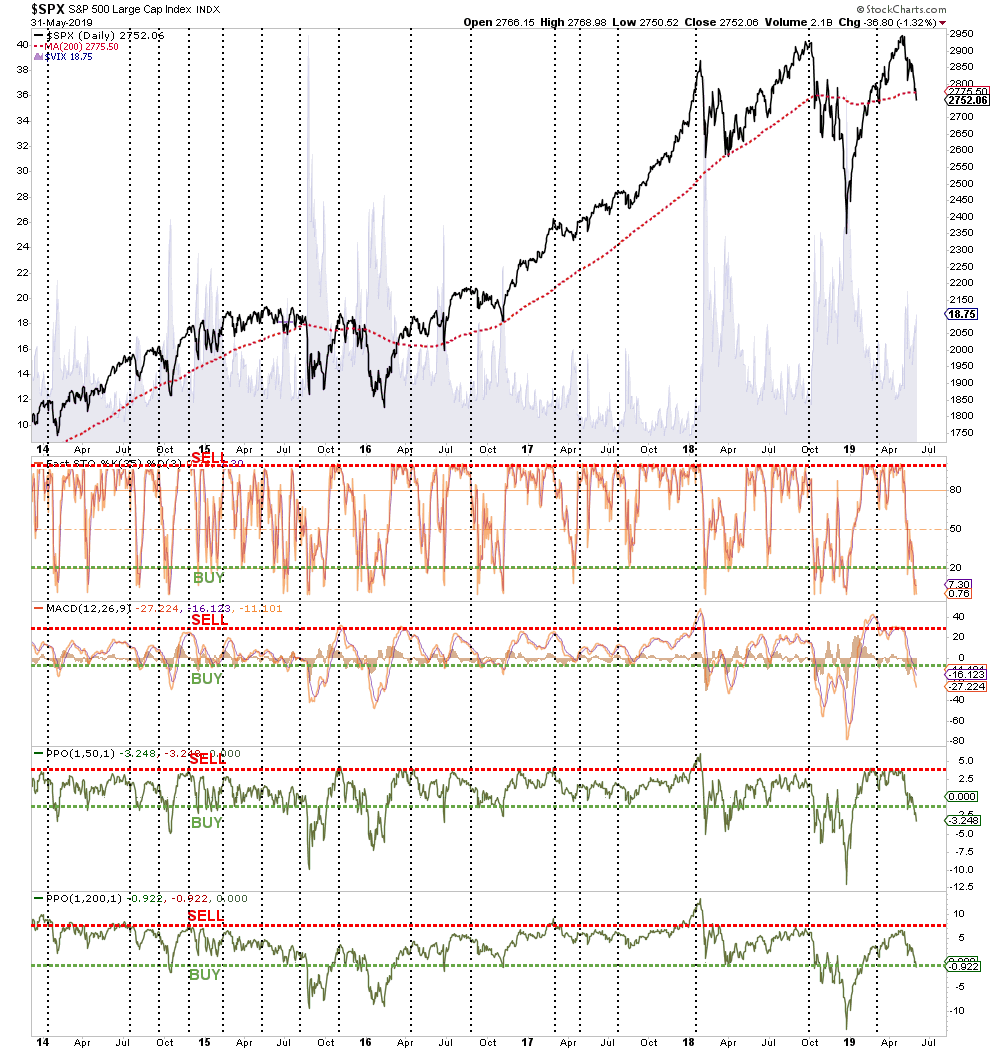
As shown below, the market did break below its 200 and 300-dma on Friday. However, the 400-dma is currently holding just below Friday’s close. Importantly, last week’s sell off did trigger an important “sell signal” suggesting prices head lower over the few weeks.
In the very short-term the markets are oversold on many different measures. This is an ideal setup for a reflexive rally back to overhead resistance.
Longer-term, the fundamental, economic, and technical backdrops have collided which increase the odds of a more significant mean reverting event. The monthly chart below shows the bull market rallies from 1991 to 2000, 2003-2007, and 2009 to present. In both previous cases the long-term overbought condition (bottom indicator) was reversed through a correction process which retraced 61.8% to 100% of the previous advance.
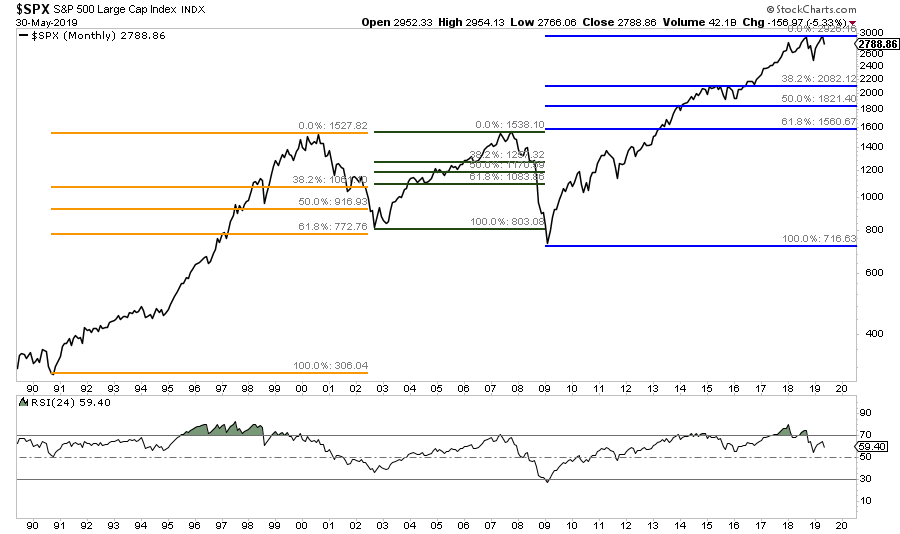
A similar retracement from recent all-time highs would see the market testing the 2007 highs at 1560.
That’s a potential 46% decline.
Such would be a NORMAL mean reverting event which would coincide with the onset of a recession.
Importantly, the current backdrop is conducive for such a reversion. As Doug Kass noted on Friday.
- We are closer to an earnings recession than in 4Q2018.
- At year end the domestic economy was prepping for a +3% Real GDP in 1Q2019 – now Real GDP is expected to slide to below +1.5%.
- The Cass Freight Index is showing profound weakness – and other high frequency economic data is weakening.
- Markets have already priced in multiple interest rate cuts.
- With rates so low now (10 year yield down nearly 100 bps), there are few tools left in the monetary shed.
- The prospects for any meaningful fiscal stimulation is gone (e.g., an infrastructure build) as the animus between the parties has intensified and will continue to erode as we move to a November, 2020 election.
- As mentioned in my opening missive, global coordination and cooperation is at an all-time low.
- A relatively smooth and non disruptive BREXIT is no longer likely.
- The trade backdrop is a mess – with disputes with Mexico and China (in particular) probably going to continue for quite a while.
- The geopolitical backdrop has deteriorated – particularly with Iran and North Korea.
- Commodities are falling (especially of a crude-kind).
- China’s economic growth is no longer stable – it’s moving lower (see last night’s manufacturing data).
- Technicals have just begun to erode.
This is why we focus on risk management and capital preservation.
The markets only need some mildly positive news at this point to spur a “short-covering” rally. I would encourage you to use it to reduce risk, rebalance holdings, and raise cash until the “trade war ‘smoke’ clears.”
If you need help, or have questions, we are always glad to help. Just email me.
See you next week.
Market & Sector Analysis
Data Analysis Of The Market & Sectors For Traders

If you are NOT an RIA PRO subscriber you are missing the most important part of each weeks’ newsletter.
- Sector & Market Performance Analysis
- Portfolio Recommendations
- What We Are Doing With Our Clients.
Try it today for FREE for 30-days.
THE REAL 401k PLAN MANAGER
A Conservative Strategy For Long-Term Investors
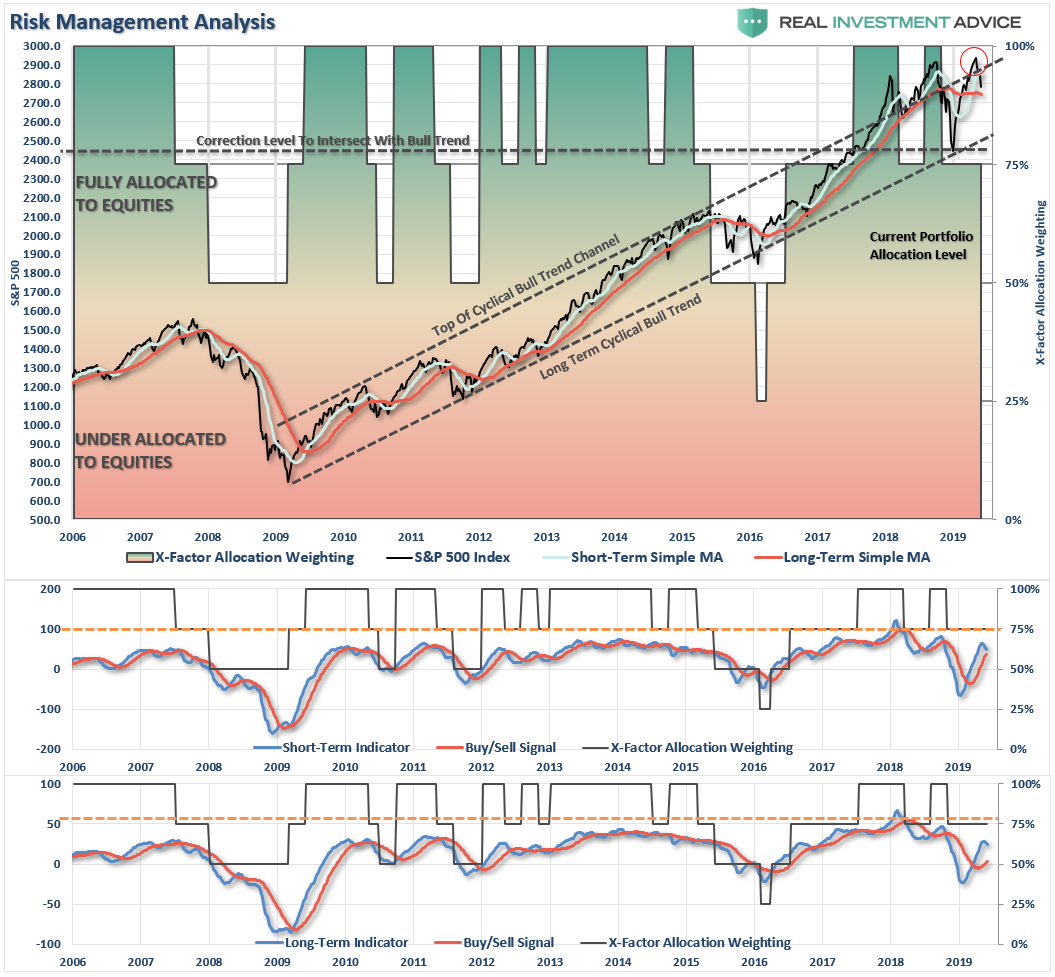
There are 4-steps to allocation changes based on 25% reduction increments. As noted in the chart above a 100% allocation level is equal to 60% stocks. I never advocate being 100% out of the market as it is far too difficult to reverse course when the market changes from a negative to a positive trend. Emotions keep us from taking the correct action.

This Is Why We Remain Patient
As noted over the last couple of weeks:
“The market tried to rally last week but failed to hold above the 50-dma which negated our plans to increase equity exposure. Next week, it is critical for the markets to muster a rally or we are going to wind up retesting the 200-dma.”
That rally failed to occur and we have now tested, and failed, the 200-dma. However, with the market deeply oversold short-term we are expecting a bounce which we can rebalance into and remain defensive.
I would again encourage you to read the commentary above, the bulls, along with the media, are betting on things which have a very low probability of actually occurring. The increasing “trade war” will only succeed in advancing the next recession.
We have remained patient over the last several weeks. However, we should get a bounce next week. On that bounce look to take the following actions:
- If you are overweight equities – take some profits and reduce portfolio risk on the equity side of the allocation. Raise some cash and reduce equities to target weights.
- If you are underweight equities or at target – rebalance risks, look to increase cash rather than buying bonds at the moment, and rotate out of small, mid-cap, emerging, international markets.
If you need help after reading the alert; don’t hesitate to contact me.
Exciting News – the 401k Plan Manager is “Going Live”
As we have been teasing over the last couple of weeks, we are just about ready to roll-out a “LIVE”version of the 401-k allocation model which will soon be available to RIA PRO subscribers. You will be able to compare your portfolio to our live model, see changes live, receive live alerts to model changes, and much more.
We are building models specific to company plans. So, if you would like to see your company plan included specifically, send me the following:
- Name of company
- Plan Sponsor
- A print out of your plan choices. (Fund Symbol and Fund Name)
If would like to offer our service to your employees at a deeply discounted corporate rate please contact me.
Current 401-k Allocation Model
The 401k plan allocation plan below follows the K.I.S.S. principle. By keeping the allocation extremely simplified it allows for better control of the allocation and a closer tracking to the benchmark objective over time. (If you want to make it more complicated you can, however, statistics show that simply adding more funds does not increase performance to any great degree.)