Technology investors hardly remember the September pullback… because it was gone in a flash.
Tech stocks have risen sharply with several big names and sectors breaking out to new highs.
Today we shine the spotlight on another big winner of late (Semiconductors) and why this sector may have more room to run.
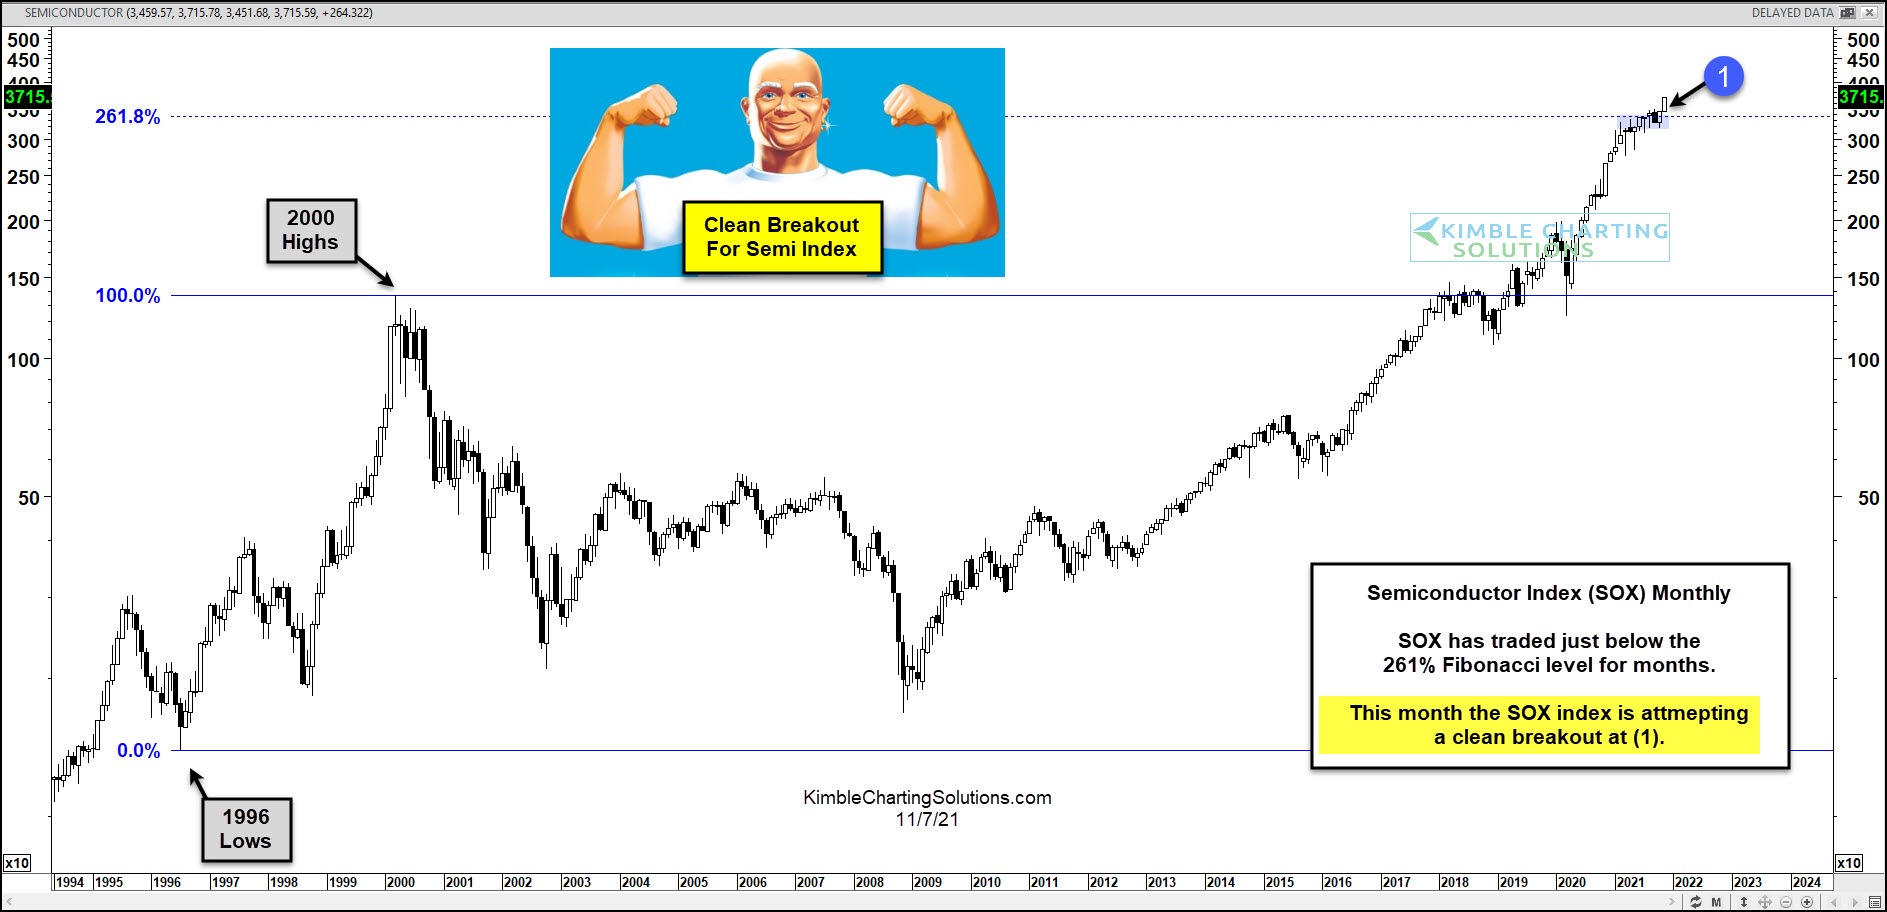
Looking at the “monthly” chart of the popular Semiconductor Index (SOX), we can see the strength of the SOX over the past several years. And when applying Fibonacci analysis, we can see the important breakout above the 2000 highs and rally up to the 261.8% Fibonacci extension level. This level has been resistance for the past several months… until now.
This month, the semiconductor index (SOX) is attempting a clean breakout above this 21-year Fibonacci extension level. This is very bullish… but the month is young so this bears watching.
This article was first written for See It Markets.com. To see the original post CLICK HERE.