The precious metals sector continues to be a “grind”, offering a few trades but mostly sideways to lower action. Gold prices have slogged along and this had held the Gold Miners (NYSEARCA:GDX) back… until recently. The Gold Miners (GDX) and the broader Gold & Silver Miners Index (XAU) came to life in September and October.
The miners are in a multi-year down trend, however there is a potential bullish setup in place. See the chart below where we highlight the ratio of the Mining Index (XAU) to the S&P 500 (SPY). The ratio, which Gold Bugs want to see rising, looks to have created a bullish reversal last month at the 2016 lows at point (1).
And October is seeing a follow-through move to the upside.
If the ratio breaks out above falling resistance at (2), it would be suggesting a long miners / short S&P 500 trade.
Mining Index (XAU) / S&P 500 (SPY) Ratio Chart
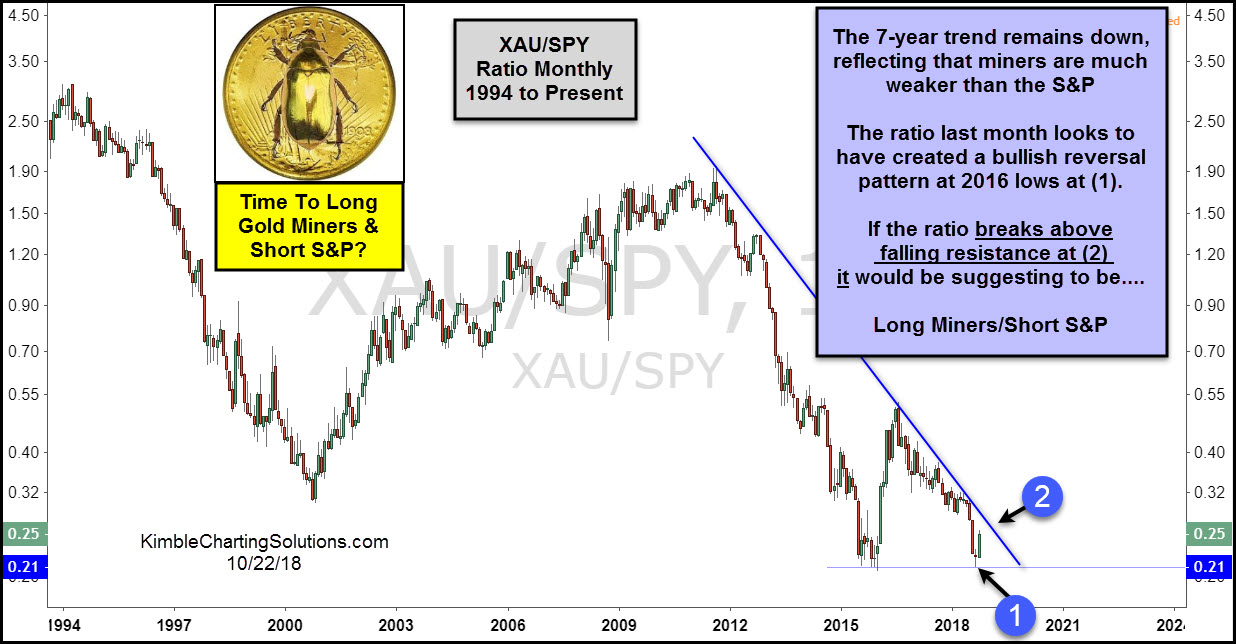
CLICK ON CHART TO ENLARGE
This article was first written for See It Markets.com. To see original post CLICK HERE
If you are interested in taking advantage of opportunities in the metals market, check out our Gold, Silver, and Miners weekly report.