The Federal Reserve’s theme song should be “If we print the money, honey, you’ve got the time … to invest.”
Here is a chart of various asset prices since the Covid virus struck in March 2020 when The Federal Reserve massively increased their balance and lowered their target rate to 25 basis points.

The Case-Shiller National home price index (HPI) is up 13.2% since Covid and Fed intervention. The Russell 2000 index is up a staggering 123.2% and the MSCI US REIT index is up 79.6%. Commodity prices are up 48.8%.
Notice that before Covid struck and The Fed intervened with a massive increase in M2 Money, commodity prices were falling and the Russell 2000 was pretty flat. Home prices were increasing, but not at a 13.2% clip.
Is this inflation, economic growth and/or a massive asset bubble produced by The Federal Reserve? The economy is growing and Washington DC is doling out money like there is no tomorrow. But if the economy is so hot, why is The Fed holding off on rate increases given that inflation is heating up?

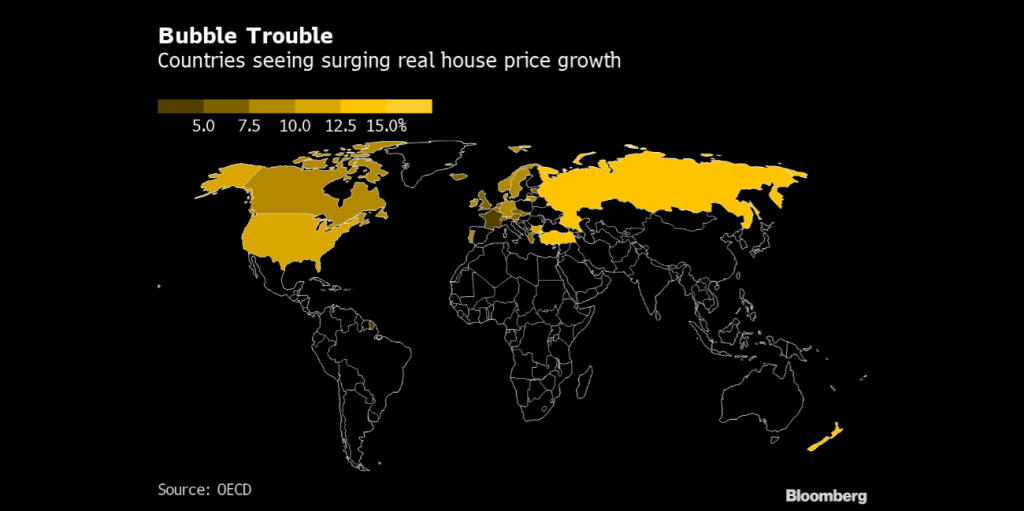
Housing is hot in Russia, Turkey, Portugal and, of course the USA. New Zealand too.
The USA, Canada and Colombia (along with the UK, the EU, Sweden, Norway, Finland and Saudi Arabia) are at zero or near zero. Throw in Australia at 0.05 and Japan at -0.1% and we have the makings of a global bubble.

Inflation may be transitory if Washington DC somehow can’t keep spending and slows down.

Here is an interesting interview with David Hunter.