by wisconsinmad
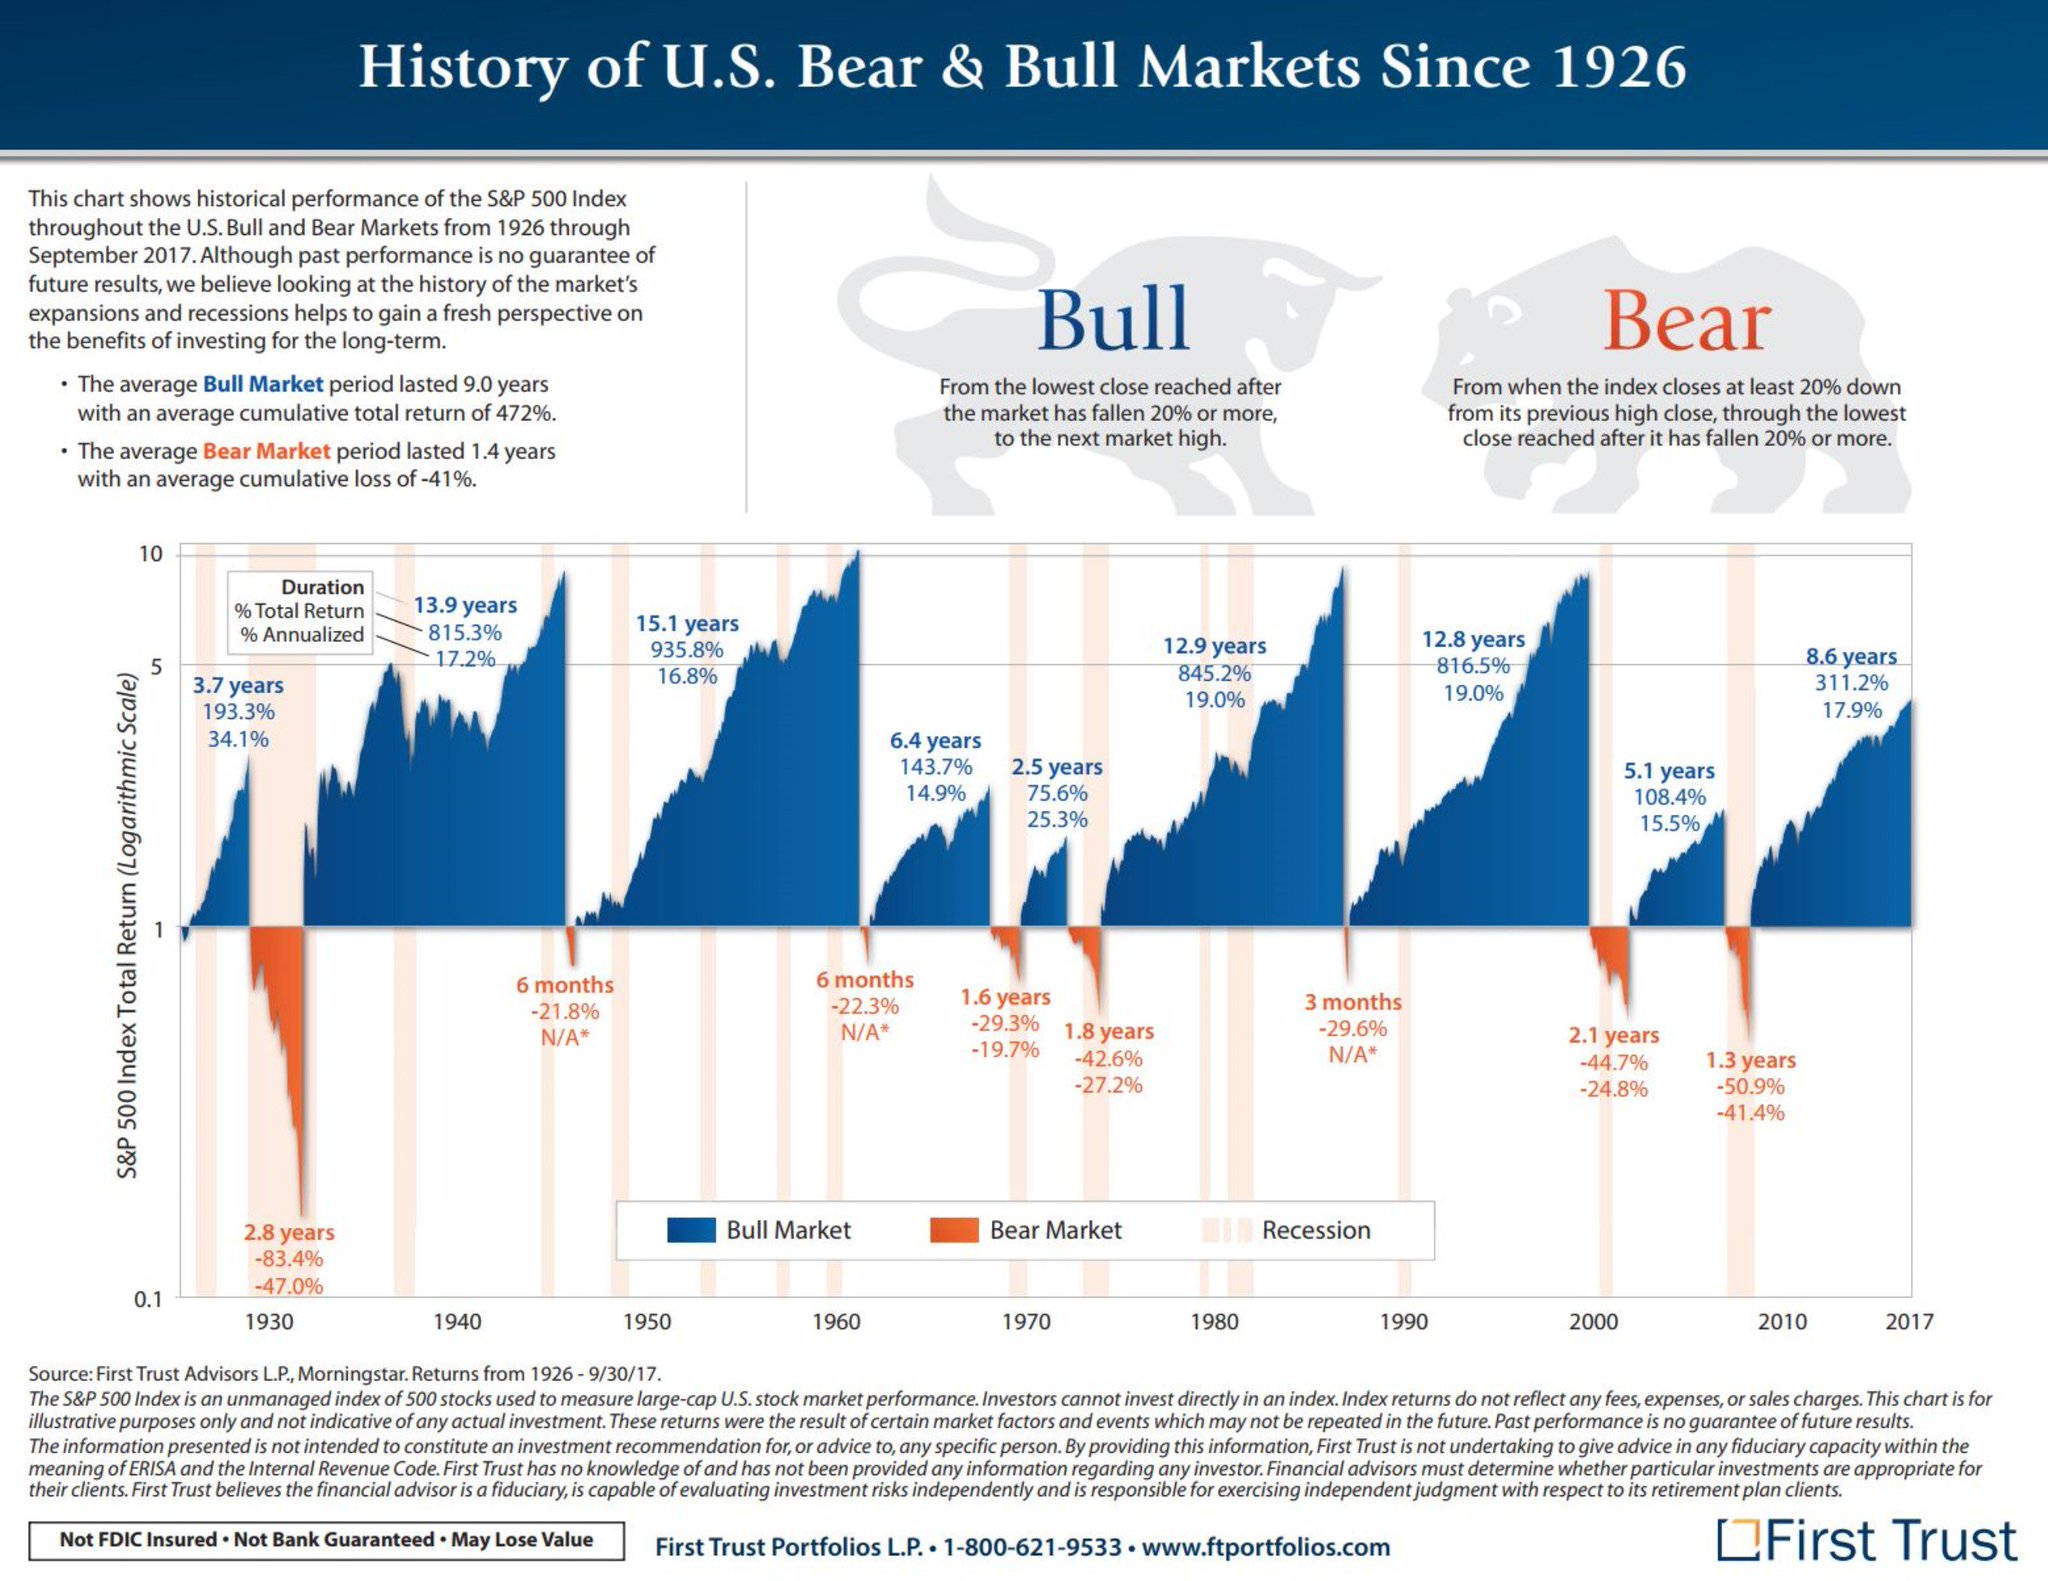
S&P-500 performance over several decades summarized pictorially
https://amp.businessinsider.com/images/52950f6a69bedd9d4346b35b-960-720.jpg
http://amarginofsafety.com/wp-content/uploads/2014/01/Return-Histogram-Through-2013.jpg
https://www.macrotrends.net/2324/sp-500-historical-chart-data
https://www.callan.com/wp-content/uploads/2019/03/Classic-Periodic-Table-2019.pdf
https://pbs.twimg.com/media/DVTKIZTX4AA9DAe.jpg:large
If anyone has any more interesting pictorial images to share for the S&P-500’s historical performance, please share in this thread.