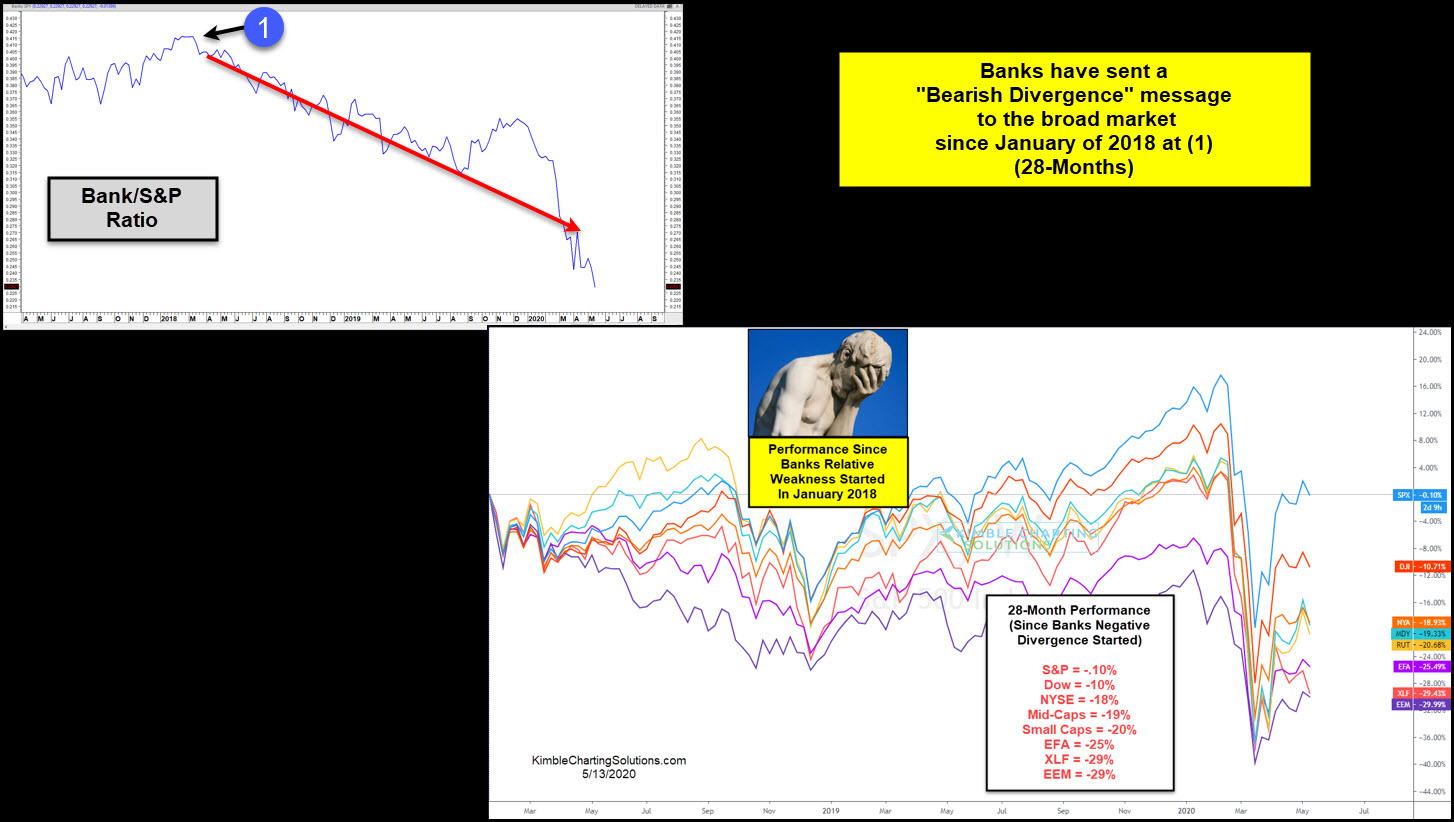
Is the saying “So Goes The Banks, So Goes The Broad Market” true? Over the past 28-months, it does appear to be accurate!
Banks started underperforming the S&P 500 in January of 2018 (28-months ago) at (1) in the upper left chart. This weakness from Banks sends a bearish divergence message to the broad market.
The lower right chart looks at the performance of several stock indices since banks started the relative weakness 28-months ago.
The S&P has the most to brag about, as it is currently flat for 28-months, which looks rather good compared to many other stock indices.
Two days ago the Power of the Pattern shared that the Bank Index was testing 800-pound resistance (four resistance lines at the same time).
Yesterday the Power of the Pattern shared that Regional Banks (KRE) was kissing the underside of two long-term resistance lines.
While it is easy to get caught up in news about the virus, don’t overlook the important messages that the Banking index continues to send the broad markets!