by -Johnny-
This is my view of SPY in the next coming weeks.
The week of 8/5, that might be the most important date. This does not mean we can’t break down before then but the chart it pointing towards that’s the week. *Do not buy puts based off of that date..
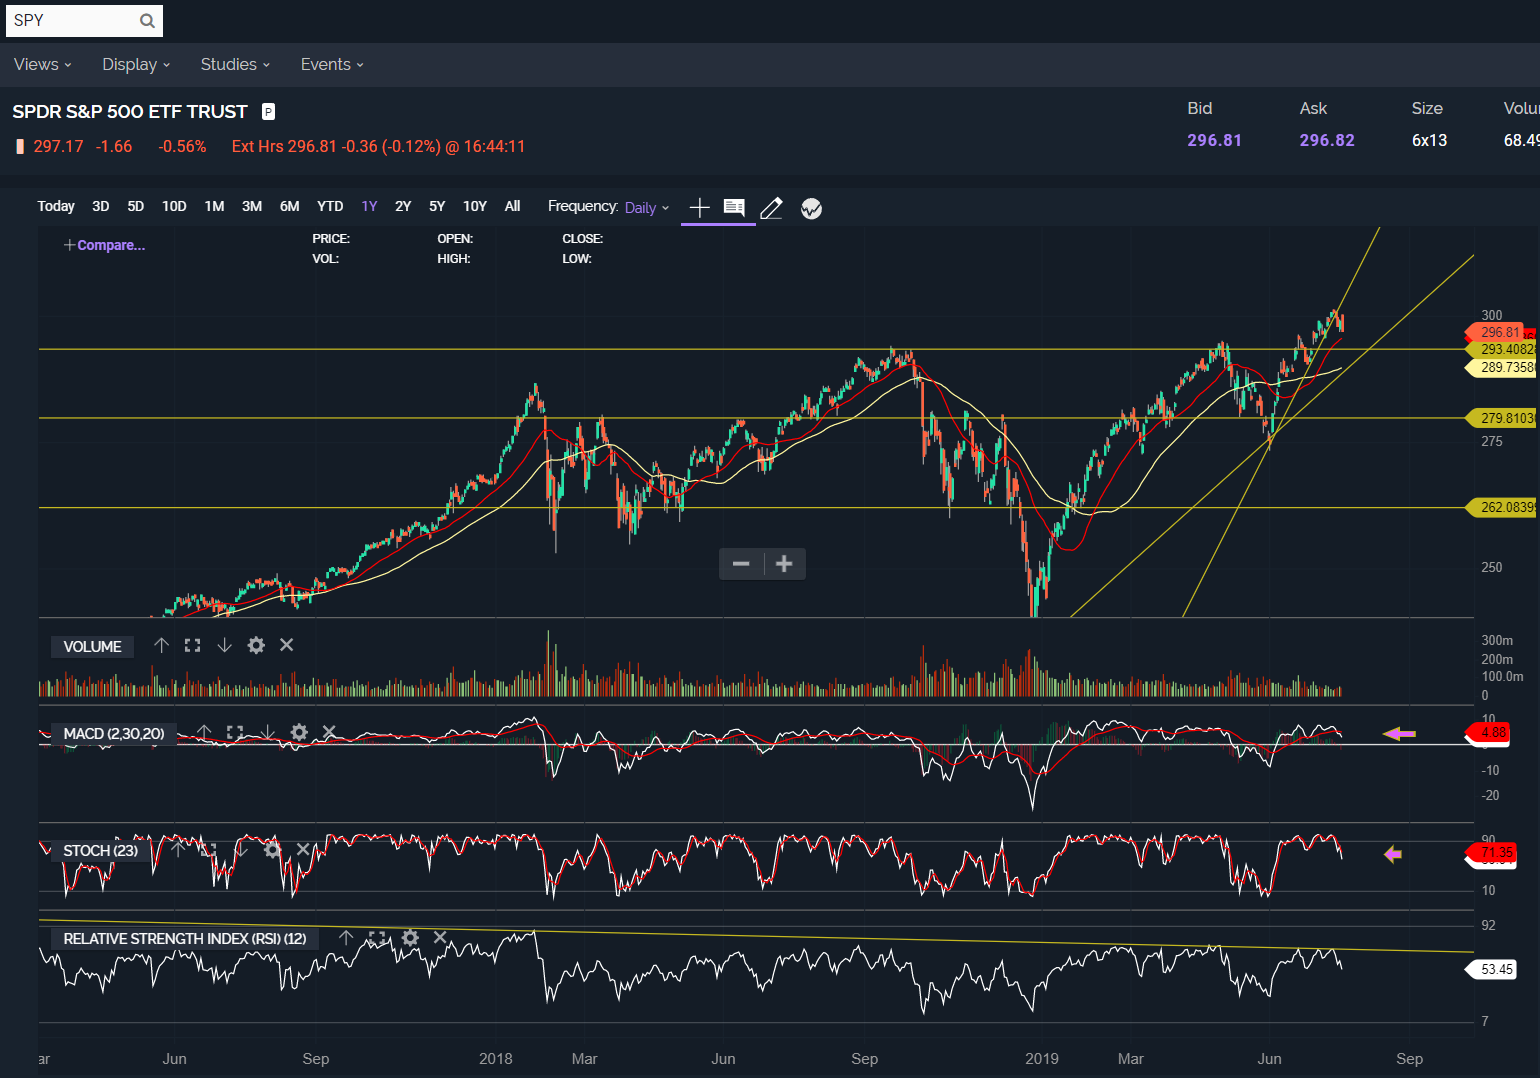
As you can see we still have the long term uptrend line to break through, we still have -2.6% to drop before we hit that line. The MACD and STOCH indicators are showing a roll over. The strength index is also showing a down trend in buyers.
Lastly, what really got me excited today was the engulfing red candles. The buyers would push SPY up a few points and then the sellers would drop triple what the buyers just pushed for.
This is not advice, rather collecting my thoughts. I’ve been a bear for a while and hopefully can print some yachts in the next month or so. Goodluck everyone.

Disclaimer: Consult your financial professional before making any investment decision.