Wolf Richter wolfstreet.com, http://www.amazon.com/author/wolfrichter
Wow, that was fast. Margin calls.
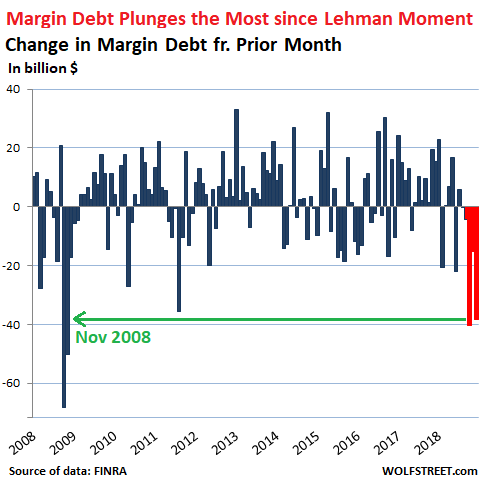
During the ugly stock-market December, whose ugliness bottomed out on Christmas Eve, a nasty November, and the ugliest October anyone can remember, margin debt plunged by a combined $93.8 billion, the most since Q4 2008, after Lehman Brothers filed for bankruptcy.
In December alone, margin debt plunged by $38.3 billion, to $554.3 billion, FINRA (Financial Industry Regulatory Authority) reported this morning. This was just a hair less than October’s plunge of $40.5 billion, and both had been the steepest drops since late 2008:
The only form of stock market leverage that is reported monthly is “margin debt” – the amount individual and institutional investors borrow from their brokers against their portfolios. But no one knows the amount of total stock-market leverage from all forms of leverage, but we know it’s a lot higher than margin debt by itself.
Stock market leverage takes many forms. It includes “securities-based loans” (SBLs) that brokers extend to their clients, and that some of them report annually, though they don’t have to. And occasionally, we get a tidbit about an individual fiasco such as when a $1.6 billion SBL to just one guy blows up. And there are other ways to use leverage to fund stock holdings, including loans at the institutional level, loans by companies to their executives to buy the company’s shares, etc. But reported margin debt gives us a feel for which direction overall stock-market leverage is going.
Stock market leverage is the big accelerator on the way up, when people and institutions borrow money to buy stocks. And it’s the big accelerator on the way down when margin calls and other financial pressures turn these investors into forced sellers. The money from the proceeds of those stock sales doesn’t then sit on the sidelines or go into other stock purchases; no, it is used to pay down that debt. And these much-hated and feared margin calls apparently have kicked off in Q4.
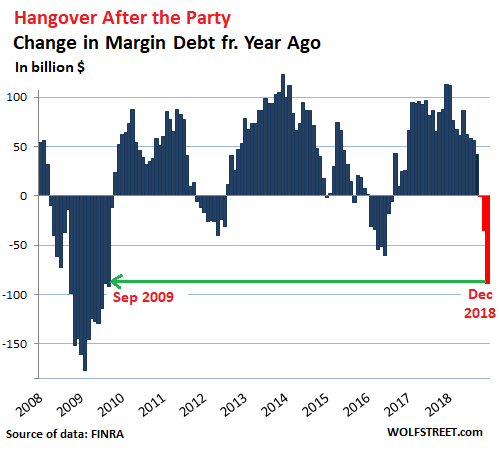
Margin debt at the end of December 2018, at $554.3 billion, was down by $88.4 billion from December 2017. It is the steepest year-over-year plunge since the Financial Crisis:
During the blistering stock market boom in recent years – part of the “Everything Bubble,” so called since nearly all asset classes inflated in unison – margin debt ballooned to $669 billion at the peak in May 2018, up 60% from the pre-Financial Crisis peak in July 2007, and up 117% since January 2012. Since the peak in May, margin debt has plunged by $114.6 billion.
Over the longer term – let’s say two decades – the tight relationship between stock market surges and sell-offs and margin debt is clear, though which causes which, and which comes first is less clear because both feed off each other, on the way up, and on the way down. Note the steep decline since May:
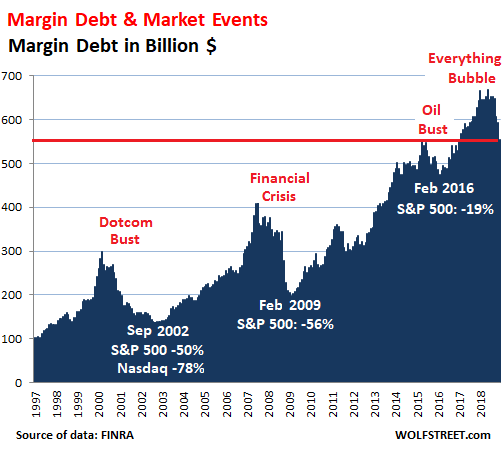
With a 20-year chart like this, the absolute dollar amounts are less relevant since the purchasing power of the dollar has dropped over the period. What is important are the movements, up and down, and how they relate to stock market events (white).
As you can see in the charts above, my dictum, repeated on December 22 — “Nothing goes to hell in a straight line” — holds from a historical point of view as well. Plunges are followed by jumps. This creates a lot of noise. But added together over time, they form a trend. The rally since December 26 tells me that people are piling back into margin debt, and that when we get the January data, margin-debt levels will have increased.
But this is how margin debt and the stock market feed each other: Surging stock prices give people the urge to pile in, and they borrow money to do so, which drives up stock prices even further. But when the rally ends and stocks head south in a significant manner, and when people are highly leveraged, they will unload stocks to pay down their margin debt, and some will be forced to do so, and this drives down stock prices further.
It is this mechanism that links margin debt and the stock market – but neither is a good predictor for the other because one might occur before the other or simultaneous with the other. But they do move in the same direction over time.
The plunge in margin debt in the third quarter took a chunk of margin debt off the table, but unwinding such a huge pile of stock-market leverage takes time, usually years, with many sharp interruptions in the opposite direction.