via upfina:
The December retail sales report was so terrible that it implies a recession is coming soon if the data is accurate. There’s always a chance the data is incorrect because these results are revised. This time there is a cloud over the report because the government was shutdown for part of December. There isn’t evidence that different methods were used to collect the data, but it’s worth noting since it is on everyone’s mind.
List Of Excuses For This Bad Report
Let’s review all the reasons this terrible report should be discounted before we dive into the details. The most obvious one is this is just one report. There have been other terrible retail sales reports this expansion that meant nothing. This one just happens to be worse than almost all of them.
Also, the November report was strong, so the month over month comparison was tough. Another positive argument is gasoline sales, which were hurt by lower prices, dragged down results. Furthermore, this holiday season had an extra week between Thanksgiving and Christmas in November, so that may have hurt sales in December. Some retailers reported Black Friday and Cyber Monday sales were amazing, but the rest of the holiday shopping season was unspectacular.
The volatile stock market could have hurt retail sales for the upper class at the time consumers usually buy their last minute gifts. The stock market doesn’t usually affect retail sales much, but this sharp decline made people who follow the stock market think the economy was on the precipice of a recession. This is the reflexivity effect where stocks cause the economy to weaken instead of predicting weakness. The signal became the catalyst. We don’t think the wet weather in the Midwest and Southeast is a good excuse for this poor report because online sales were also weak.
Headline Results
Overall monthly retail sales growth was -1.2% which missed estimates for 0.1% and November’s growth of 0.1%. That was the worst decline since September 2009. About 75% of these reports are within -1% and +1%.
As the chart below shows, monthly sales excluding autos were down 1.8%. That missed estimates for no growth and November’s zero growth. This result was worse than overall growth because autos were one of the bright spots in this report.
US Retail sales unexpectedly fall the most in 9yrs amid financial mkt turmoil and govt shutdown. Retail sales ex Autos down 1.8% MoM vs +0.1% expected. https://t.co/IczYRa1zUL pic.twitter.com/CaDECgQ6DJ
— Holger Zschaepitz (@Schuldensuehner) February 14, 2019
Excluding autos and gas, monthly sales fell 1.4% which missed estimates for 0.5% growth and November’s growth of 0.5%. Excluding the decline in gas sales helped growth. Retail and food service sales ex-gas were up 2.9% year over year. Core retail sales growth was 1.9% year over year. We’re not in recession territory, but further weakening will put the economy in one. As we mentioned, the November report was strong. This shows up in the control group’s monthly sales growth which was 1% in November and -1.7% in December. December’s estimates were for 0.4% growth.
Context Of This Report
This report needs to be put into context to explain why it missed the consensus by so much. Let’s review why economists were optimistic. The labor report was strong, showing 222,000 jobs added and 3.5% weekly wage growth. Jobless claims bottomed in September, but were still low. The JOLTS report showed a 7.1% year over year increase in hiring in December. Consumer sentiment was 98.3 in December which is very good. The biggest source of optimism was the amazing Redbook same store sales growth in December. The weekly reading peaked at 9.3% yearly growth in December which was the highest of the cycle.
The chart below aims to show the divergence between the Redbook report and retail sales.
https://twitter.com/teasri/status/1096076520588787712
It’s tough to see, but the major peak in the blue line (Redbook) occurs when the orange line (core retail sales) plummets. In the past few weeks jobless claims have moved up modestly (239,000), Redbook same store sales growth has fallen (4.6% in the week of February 9th), and consumer sentiment fell (91.2 in January). (Consumer sentiment then rose modestly in February to 95.5). The million dollar question is if this retail sales report was way off or if these other weaker reports, which weren’t correlated with retail sales in December, mean retail sales will get much worse in January and February. If the latter is the case, we could be looking at negative Q1 GDP growth.
Effect On GDP Estimates
This retail sales report and the business inventories report, which showed -0.1% monthly inventory growth in November, which missed estimates for 0.2% growth and 0.6% growth in October, caused Q4 and Q1 GDP growth estimates to crash. Barclay’s lowered its Q4 GDP tracking estimate by 0.7% to 2.1%. Morgan Stanley lowered their Q4 estimate by 0.6% to 3.1%. The CNBC median of 11 estimates expects 2.4% growth. The Atlanta Fed’s Nowcast was pushed from 2.7% to just 1.5% as the estimate for real personal consumption growth fell from 3.7% to 2.6%. Morgan Stanley’s Q1 estimate could be as low as 1%. UBS’s Q1 growth estimate is 0.4%. GDP forecasts are acting like this retail sales report means more doom for Q1, while the stock market is acting like December is the ancient past that is irrelevant to the future.
As the chart below shows, stocks don’t do well when retail sales less food service are down 1.5% or more.
https://twitter.com/UncleRico77/status/1096092919600201729
There have been 3 other instances of this since 1992. They occurred right before the top in 2000, during the 2001 recession, and during the last recession. The average S&P 500 return in the next year is -11.03%.
Report Details
Every category in this report was negative on a monthly basis besides auto dealers, vehicles and parts, and building materials which were up 1.1%, 1%, and 0.3%. Gas sales were down 5.1% monthly and 0.2% yearly because oil prices fell. That savings on gas didn’t transfer to more spending elsewhere. Sporting goods sales were the worst yearly as they fell 13%.
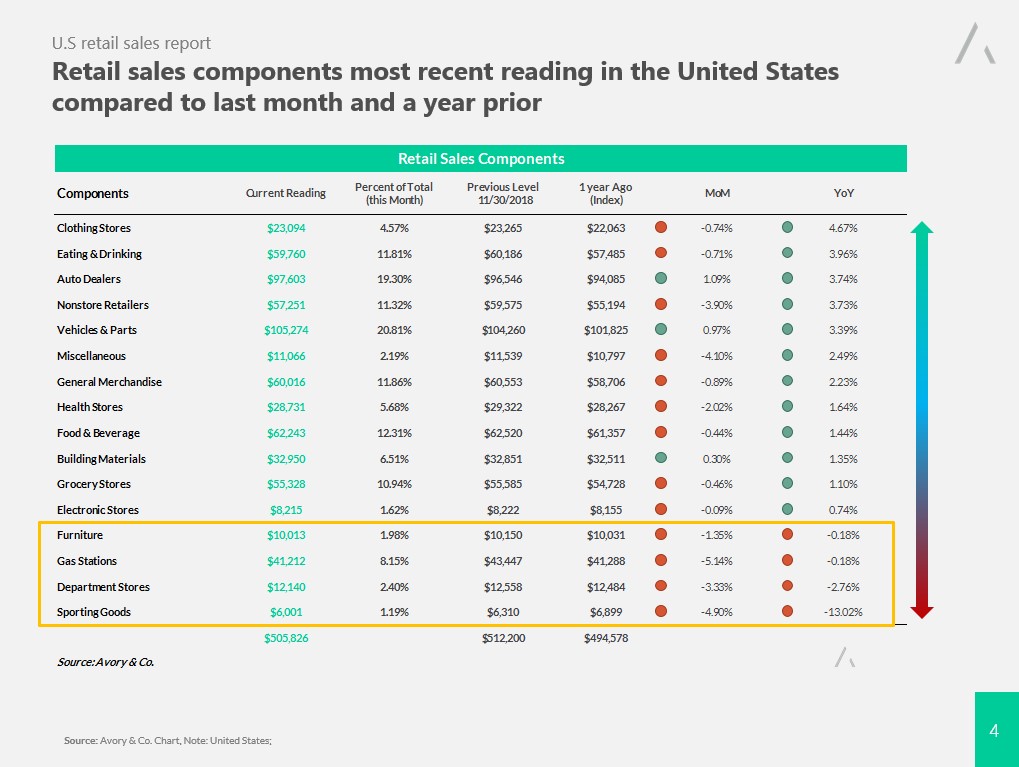
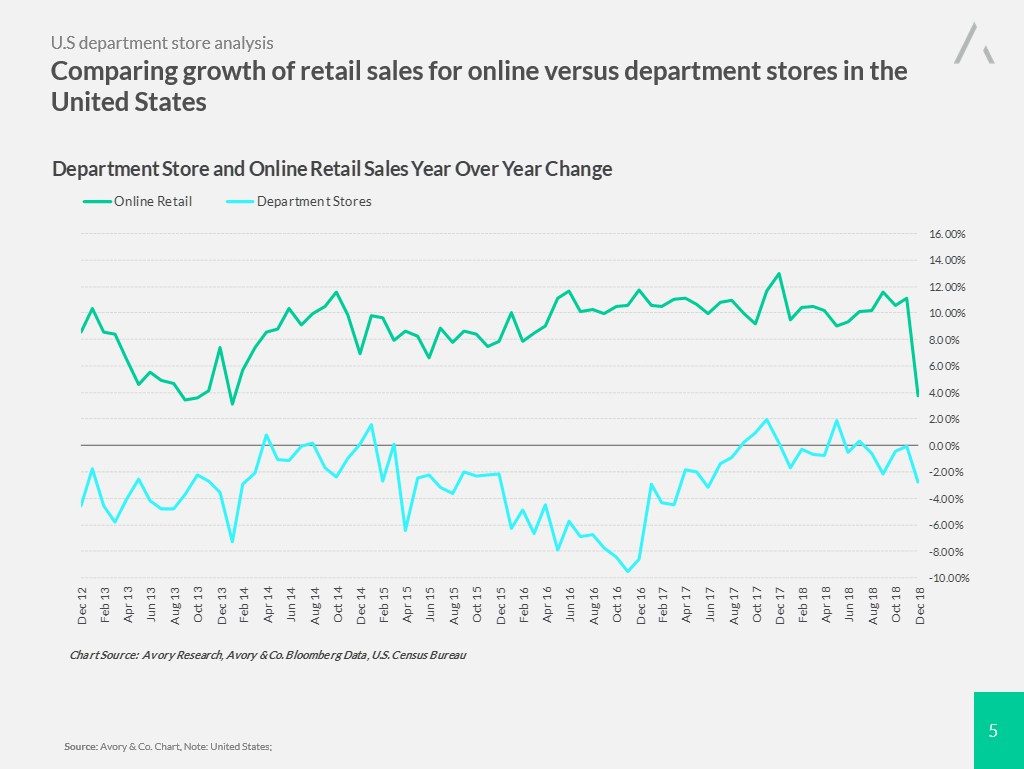
Department store sales were down 3.3% monthly and 2.8% yearly. Online retail sales were a disaster as they fell 3.9% monthly and were up 3.7% yearly. The chart below shows the department store sales decline is part of a larger trend, while the online sales growth decline came out of nowhere. Online sales are 11.32% of total sales, so they move the needle.
Conclusion
This retail sales report was unusual because it came out in mid-February which means it is far in the rearview mirror. It’s easy to discount. If these results are accurate, the economy could be headed for a recession. However, the consumer could easily rebound in March since the stock market is rallying, the labor market is great, and the government shutdown is over.