by Dana Lyons

Despite extreme daily volatility, the stock market has been mired in a historically tight range.
If it seems as though the stock market has been crazy volatile lately without really going anywhere, you’re not imagining things. Over the 2 weeks (i.e., 10 days) through last Friday (4/6), the S&P 500 (SPX) averaged a daily trading range of 2.3%. That’s in the 94th percentile for volatility since the inception of the SPX in 1950. The more remarkable thing, though, is the fact that the total range in the SPX over those 2 weeks is just 4.6%. Since 1950, there have been just 13 other times (or 0.07% of all days) that saw as much daily volatility confined in such a relatively tight 2-week range.
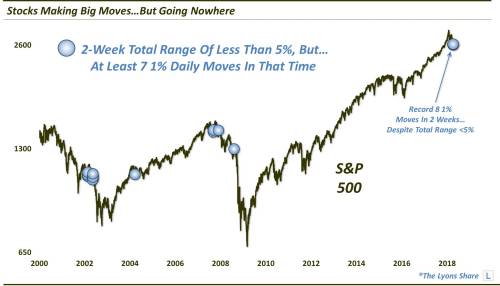
Furthermore, over those 10 days, the S&P 500 experienced 8 daily price changes of at least 1%, with 4 of them exceeding 2%. If that seems like a lot, you’re right again. Since 1950, just 1% of all 2-week periods contained as many as 8 1% moves. None of them occurred within a 2-week range of less than 5%, as this one did. And, as this chart shows, just 14 times did the SPX experience 7 daily moves of at least 1% within a 2-week range of less than 5%.
So what will the outcome of this volatile, “running in place” market be? One conventional thought is that, once the lid, or bottom, to this range is opened, the pent-up volatility will be unleashed in an out-sized move in the direction of the breakout. We don’t necessarily disagree with that notion – though, if recent history is any guide, the out-sized move may also be part of an initial “false” move as well.
Which way will the market break? Another, perhaps, conventional take is that the present range is in the form of a “bear-flag”, or a tight consolidation pattern that will eventually lead to a breakdown and a fresh move to the downside. We can’t take much exception to that interpretation – other than the fact that it has been an unreliable one in recent years when applied to the popular major indices. So it wouldn’t surprise us to see that scenario play out…but it wouldn’t surprise us to see it fail either.
One gloomy observation from a cursory glance at the prior examples on the chart above is that most of them occurred during bad markets, or in the transition to a bad market. That’s perhaps not surprising since elevated volatility tends to occur during corrections and bear markets, etc. But is it just a fluke in this case? Are there enough samples for a rigorous conclusion?
In a Premium Post at The Lyons Share, we take a deeper dive into these “elevated but constrained volatility” periods, both past and present. The result is an evidence-based expectation for the outcome in the near-term – as well as a reasonable assessment about how much we should worry about the troubling long-term track record after prior examples.