For the past 19-years, the Nasdaq Composite Index has been stronger than the S&P 500.
Is this trend about to change?
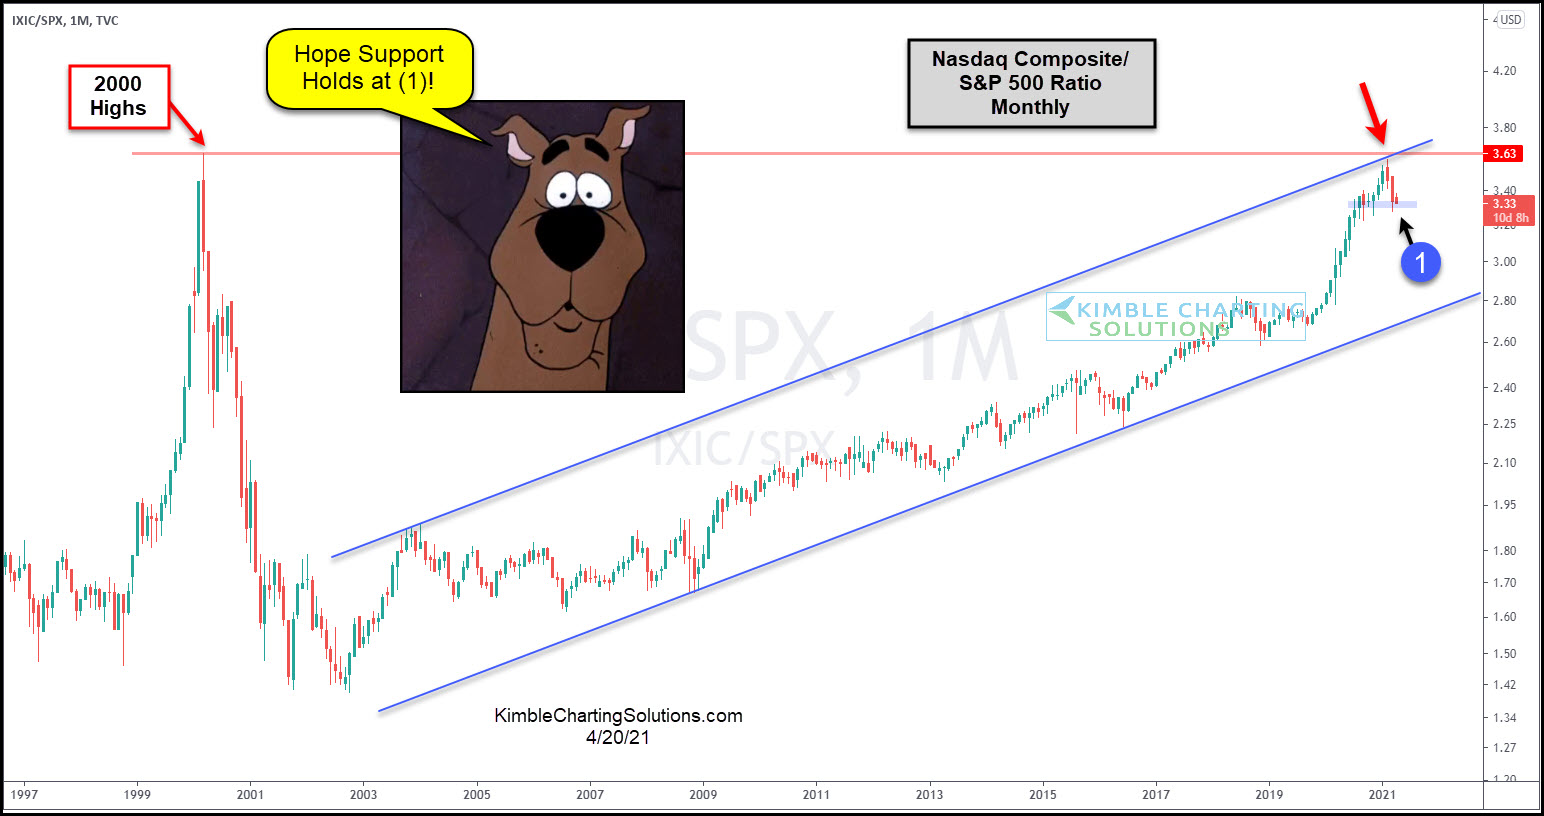
This chart looks at the Nasdaq Composite Index/S&P 500 ratio since 1997. It peaked in 2000 and fell like a rock, as tech stocks fell much harder than the broad market after the Dot.com highs.
Since the ratio double-bottomed in 2002-2003, it has created higher lows and higher highs, reflecting strength from tech.
Some weakness in the ratio is taking place after it hit the top of its long-term rising channel as well as the 2000 highs a couple of months ago.
The trend remains up, which is bullish for tech.
If the ratio would break support at (1), it would send a negative message from the Tech sector! Keep a close eye on what this ratio does over the next couple of months, as the markets about to enter the “Sell In May and go away” time frame!