by UPFINA
Inflation is still very low. CPI in August was 1.3% which was up from 1%. Core CPI was up from 1.6% to 1.7% which put it slightly closer to the Fed’s 2% target as you can see from the chart below. The issue here is that core PCE inflation is almost always lower than core CPI, which means the Fed isn’t near its target. If the Fed used core CPI to judge its policy, it wouldn’t have been as far off from its target in the past 14 years. It’s notable that COVID-19 connected purchases such as toilet paper have had 1.85% inflation because of increased demand.
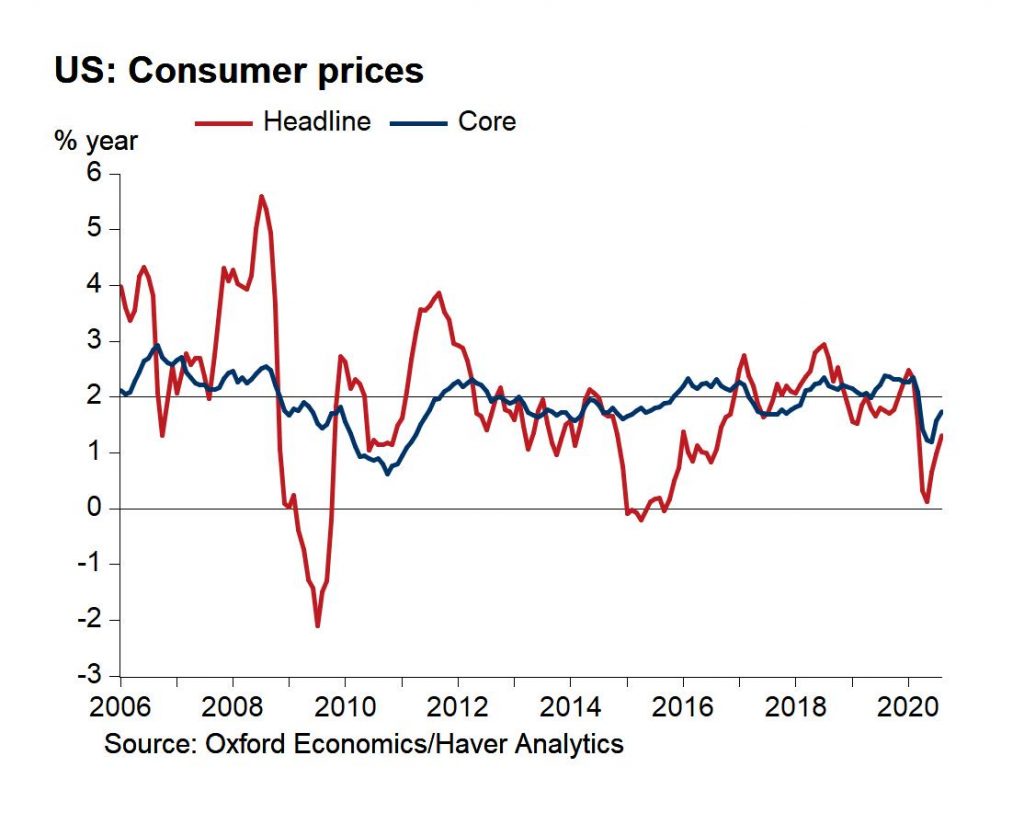
Energy drove down headline inflation again as its prices fell 9%. On the other hand, food inflation was 4.1% as food at home prices were up 4.6%. That was driven by meats, poultry, fish, and eggs again as their prices were up 7.1%. Dairy and related products had inflation of 5.7%. As has usually been the case in the past few years, services inflation drove core CPI higher as it was 2.2%. Shelter inflation was only 2.3% which is interesting because home prices have been increasing due to strong demand stemming from low rates and some people moving to the suburbs.
CPI bases shelter inflation on rent prices, so this reading won’t correlate with near term moves in the Case Shiller index. In June, the Case Shiller index was up 4.3%. Since housing has been strengthening, price growth may have increased in the past 2 months. Transportation services inflation was -4% and medical care services inflation fell 0.6% to 5.3%. However, that decline was off the highest level in 20 years due to a 1% tougher comp. The 2 year stack actually increased 0.4%. As comps get harder in the next few months, this rate will likely fall. It will be interesting to see how people going back to getting elective surgeries affects the healthcare system. Unfortunately, many hospitals are in dire financial straits and fired many workers.
If you’re just using this CPI report to see if the long term bond and tech will sell off, rest assured, inflation isn’t heating up enough for that. It would take very little inflation to boost the 10 year yield and cause tech stocks to fall. We don’t even have enough inflation to jump over that low bar yet.
Home Affordability Could Fall
As you can see from the chart below, in the past few years home prices have been inching towards per capita income. Per capita income spiked in April because of the stimulus money. It has since fallen since then and home prices have risen. That means if we included the latest data in this chart, home prices would look slightly more problematic (too expensive). The worst case scenario is what happened in the 2000s. Home prices became unaffordable and then interest rates rose. We aren’t there yet. This isn’t a housing bubble.
We are pushing the limits of income and home price growth together. The 2 biggest housing positives ever in history are in line together now, which can lead to unhealthy real price growth. Now, it hasn't happened yet; Covid19 took some juice away, but be mindful. pic.twitter.com/HeHLyX0AgS
— Logan Mohtashami (@LoganMohtashami) September 11, 2020
That being said, it’s certainly possible some of the home improvement stocks could be too high. The idea that consumers are going to work on their home as much in 2021 as they did in 2020 when they were stuck in their homes seems dubious. Firstly, there’s no need to fix what was just redone. Secondly, COVID-19 related restrictions will be much lower (hopefully). Thirdly, people are going to want to spend money on all the activities they couldn’t do in 2021 (concerts, sporting events, travel, etc.).
Triple Leverage Is Becoming Popular
With the Nasdaq recently falling 10% in 3 days which was the quickest correction ever, you might be thinking a lot of the froth is gone in the Nasdaq. Think again! As you can see from the top chart below, the TQQQ, which is the triple leveraged Nasdaq 100 ETP, had its largest weekly inflow ever in September. It is in the top 5 in fund flows and volume this week. No leveraged ETP has ever been this big or popular, not even the TVIX which doesn’t exist anymore after the short VIX debacle in early 2018.
Largest weekly inflow to $TQQQ (3x return of Nasdaq 100) EVER while plain old $QQQ has largest outflow since Feb 2018.
Because just buying the Nasdaq 100 isn't enough. pic.twitter.com/2uXbI7XQy5
— Sarah Ponczek (@SarahPonczek) September 11, 2020
On the other hand, the normal QQQ Nasdaq 100 index had its largest outflow since February 2018. Investors want more leverage with their dip buying. The triple leveraged Nasdaq 100 index became the first ever ETF to have a total return of 10,000%. These types of returns encourage wild gambling. It’s easy for fund managers to stealthily go leveraged long the Nasdaq 100 instead of doing actual risk management. Looking at valuations has been a loser’s bet.
In a similar vein to the triple leveraged Nasdaq 100 ETP gaining more money, individual tech darlings have seen an explosion in call buying. As you can see from the chart below, Amazon Netflix, and Microsoft have seen big spikes in their call options’ open interest in the past few weeks. There has been extreme buying in ‘out of the money’ Tesla call options this summer. When this buying occurs, dealers need to buy the underlying to hedge their exposure which causes the stock to rise. That’s artificially pushing the stock up. It’s the tail wagging the dog.
🌎 SoftBank Reconsiders Trading Strategy That Hurt Shares – Bloomberg
*Link: https://t.co/kksaOOlVy3 pic.twitter.com/Tp6zaviMMH— Christophe Barraud🛢🐳 (@C_Barraud) September 12, 2020
Interesting Review
The chart below is purely food for thought. It shows the excess returns of various strategies from 1990 to 2016. It’s only food for thought because after a strategy does well, it gets overcrowded and then it fails. This explains why value stocks have done poorly in the past few years. It used to be a very popular strategy. Obviously, that’s only part of the reason why it has floundered. Value stocks have been hurt by the decline in energy prices since energy is a key value sector. Similarly, the banks have been hurt by low rates.
In fact, Credit Suisse found that “Quality Traps” (high quality, poor momentum, expensive) were the second worst-performing group of stocks from 1990-2016. 10/11 pic.twitter.com/828s90lH9l
— Intrinsic Investing (@IntrinsicInv) September 11, 2020
It’s no surprise the ‘worst in class’ group does the worst in this chart. We wouldn’t start buying the worst companies just because these stocks have done poorly. Those are the returns you should expect. On the opposite side, ‘best in class’ did well. Other than those obvious points, restructuring firms and value traps had high excess returns, while quality traps and momentum traps did badly. A quality trap is a stock that has products that lose relevancy. It ranks high on quality, has poor momentum, and is expensive. Imagine a brand that was once best of breed, but loses popularity or gets disrupted. Nokia and Blackberry may have once been quality traps with cell phones.
Conclusion
CPI increased slightly, but it’s not going to drive rates higher or tech lower if it stays this low. Housing isn’t in a bubble, but it’s getting less affordable. Investors have piled into the triple leveraged Nasdaq 100 and are buying big tech call options which is pushing their stocks up. Quality trap stocks did poorly and restructuring stocks did well from 1990 to 2016.