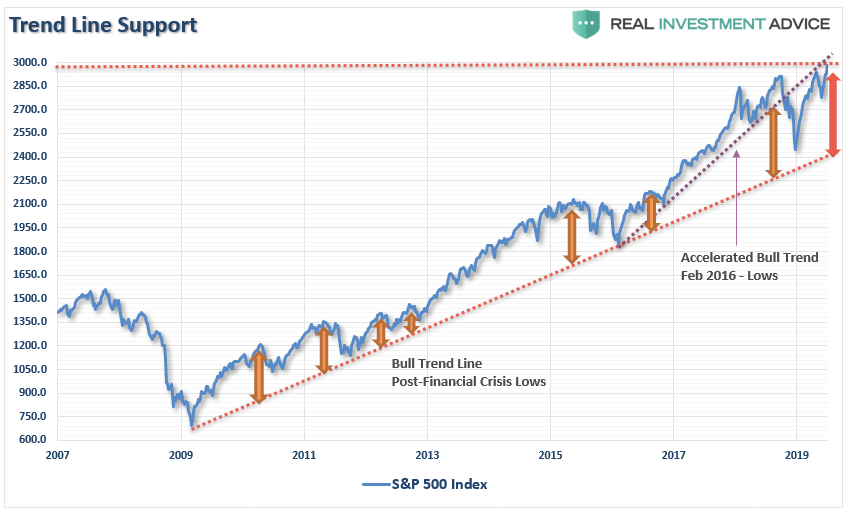
In this past weekend’s newsletter, I discussed the rather severe extensions of the market above both the longer-term bullish trend and the 200-dma. To wit:
There is also just the simple issue that markets are very extended above their long-term trends, as shown in the chart below. A geopolitical event, a shift in expectations, or an acceleration in economic weakness in the U.S. could spark a mean-reverting event which would be quite the norm of what we have seen in recent years.”
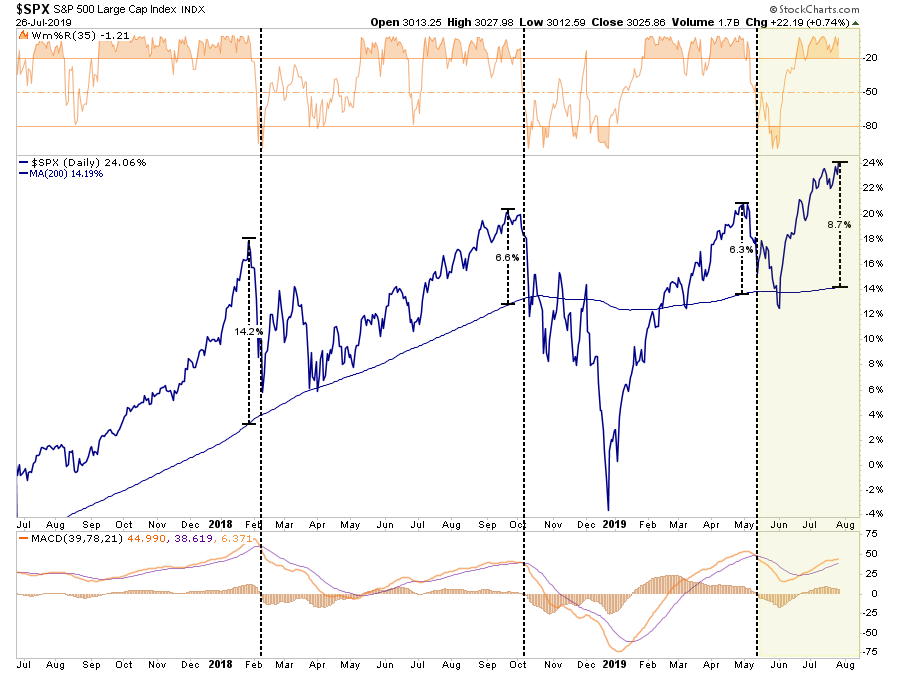
“As shown below, while the market is on a near-term “buy signal”(lower panel) the overbought condition, and near 9% extension above the 200-dma, suggests a pullback is in order.”
Of course, discussing the potential of a market correction is almost always perceived as being “bearish.” Therefore, by extension that must mean that I am either all in cash or shorting the market. In either case, it is assumed I “missed out” on previous advances.
If you have been reading our work for long, you already know we have remained primarily invested in the markets, but hedge our risk with fixed income and cash, despite our “bearish” views. I am reminded of something famed Morgan Stanley strategist Gerard Minack said once:
“The funny thing is there is a disconnect between what investors are saying and what they are doing. No one thinks all the problems the global financial crisis revealed have been healed. But when you have an equity rally like you’ve seen for the past four or five years, then everybody has had to participate to some extent.
What you’ve had are fully invested bears.”
While the mainstream media continues to misalign individuals expectations by chastising them for “not beating the market,” which is actually impossible to do, the job of a portfolio manager is to participate in the markets with a predilection toward capital preservation. This is an important point:
“It is the destruction of capital during market declines that have the greatest impact on long-term portfolio performance.”
It is from that view, as a portfolio manager, the idea of “fully invested bears” defines the reality of the markets that we live with today. Despite the understanding the markets are overly bullish, extended and overvalued, portfolio managers must stay invested or suffer potential “career risk” for underperformance.What the Federal Reserve’s ongoing interventions have done is push portfolio managers to chase performance despite concerns of potential capital loss.
Managing portfolios for both risk adjusted returns while protecting capital is a delicate balance. Each week in the Real Investment Report (click here for free weekly e-delivery) we discuss the risks and challenges of the current market environment and report on how we are adjusting our exposures to the market over time. I wanted to share these charts from our friends at Crescat Capital which are all sending an important message. Currently, these are “risks” the market is ignoring, but eventually they will matter, and they will matter a lot.

Valuations
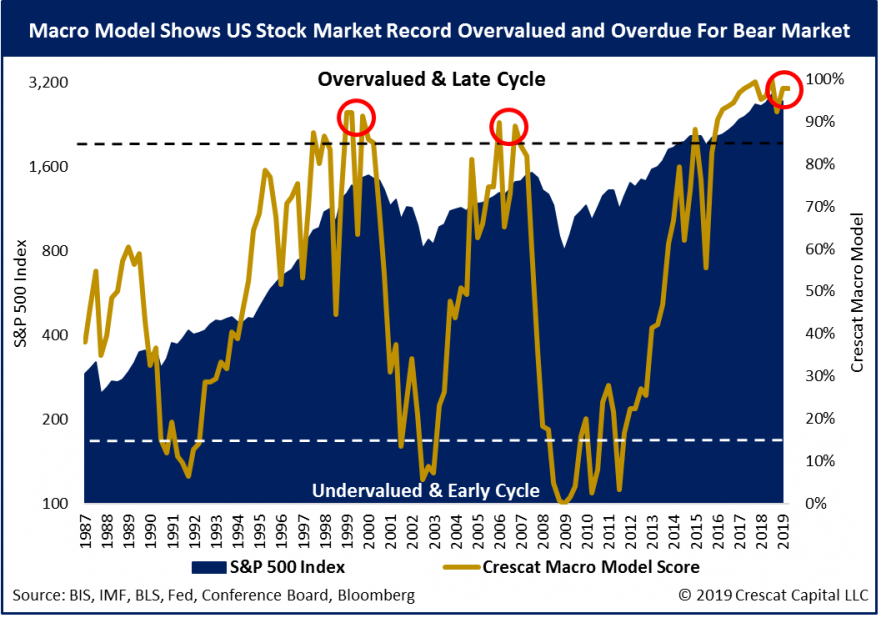
One of the consistent drivers behind the bull market over the last few years has been the idea of the “Fed Put.” As long as the Federal Reserve was there to “bailout” the markets if something went wrong, there was no reason NOT to be invested in equities. In turn, this has pushed investors to not only “chase yield,”due to artificially suppressed interest rates but to push valuations on stocks back to levels only seen prior to the turn of the century. As Crescat notes:
“ The reality is that stocks have never been this expensive for how low the 10-year Treasury yield is today. It’s true that all else equal, low interest rates justify higher valuations. However, the lowest interest rates historically haven’t corresponded to the highest P/E markets because extremely depressed yields also signal fundamental problems in the economy. Ultra-low rate environments are often marked by highly leveraged economies where future growth is likely to be weak.”
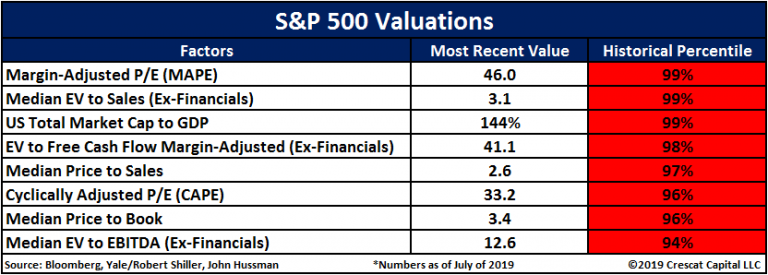
Given that valuations are all in the 90th percentile of historical values, it suggests that a reversion to the mean is increasingly likely.
Given these valuations are occurring against a backdrop of deteriorating economic growth and corporate profits, the risk to investor capital is high.
Divergences
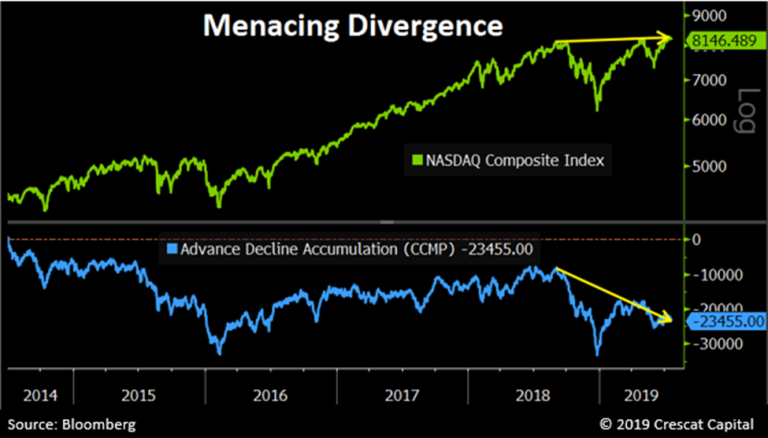
I have previously addressed the narrowing of participation in the markets. Much of the advance in the markets this year alone can be solely accounted for by a handful of mega-capitalization stocks. Since those mega-cap reside in both the Nasdaq and the S&P 500 index, the lack of breadth is worth noting. As Crescat points out:
“While many US equity indices have marginally broken out to new highs recently, they have done so in the face of weakening market internals. Equity indices are being propped up by a narrowing group of leaders. The deteriorating breadth is most evident in the NASDAQ Composite, home to today’s leading growth stocks. While the overall index has reached record levels, the number of declining stocks has significantly outpaced the number of advancing stocks since last September. The collapsing internals point to an exhausted bull market.”
Volume & Participation
Another warning sign is that volume and participation have have also weakened markedly. These are all signs of a market advance nearing “exhaustion.” Back to Crescat:
“Stocks are also rising in defiance of extremely low volume. On July 16th, the SPDR S&P 500 ETF (SPY) had its lowest daily volume in almost 2 years. In a 15-daily average terms, volume is now as low as it was at the peak of the housing bubble and prior to the last two selloffs in 2018. Unusual calmness and breadth deterioration are not a good set up for record overvalued stocks.”

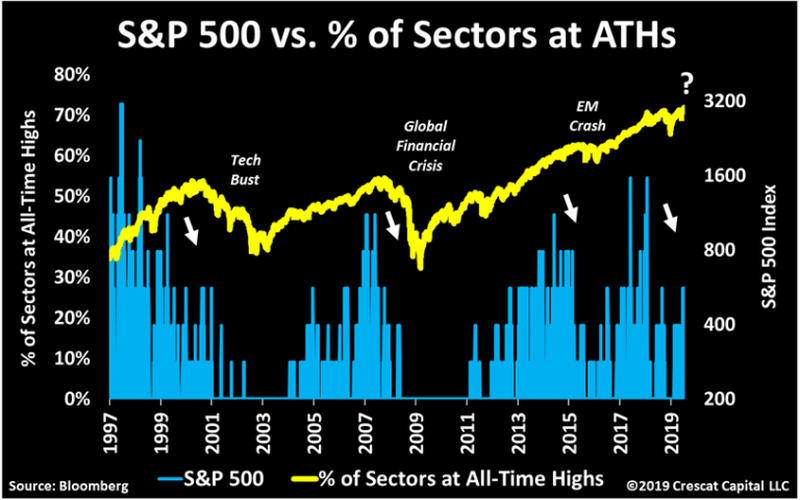
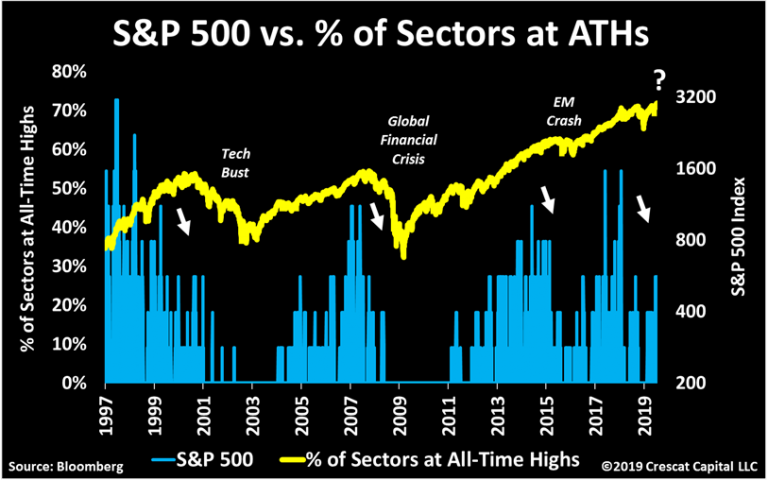
“The following chart is yet another illustration of how this recent rally in equities is running on empty, and again lacking substance. On July 15th, S&P 500 reached record levels, but only three sectors were at all-time highs. Market breadth today is faltering just as much as it did ahead of the last two recessions. In 2015, this was also the case, but back then only 20% of the yield curve was inverted. Now it’s close to 60%!”

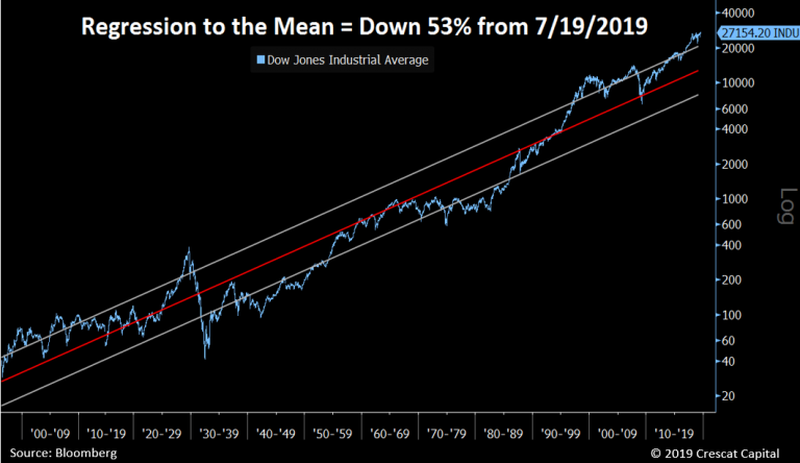
Deviation
I have written many times in the past that the financial markets are not immune to the laws of physics. As I started out this missive, the deviation between the current market and long-term means is at some of the highest levels in market history.
There is a simple rule for markets:
“What goes up, must, and will, eventually come down.”
The example I use most often is the resemblance to “stretching a rubber-band.” Stock prices are tied to their long-term trend which acts as a gravitational pull. When prices deviate too far from the long-term trend they will eventually, and inevitably, “revert to the mean.”
As Crescat laid out, a “mean reverting” event would currently encompass a 53% decline from recent peaks.
Does this mean the current bull market is over?
No.
However, it does suggest the “risk” to investors is currently to the downside and some caution with respect to equity-based exposure should be considered.
Sentiment
Lastly, is investor sentiment. When sentiment is heavily skewed toward those willing to “buy,” prices can rise rapidly and seemingly “climb a wall of worry.” However, the problem comes when that sentiment begins to change and those willing to “buy” disappear.
This “vacuum” of buyers leads to rapid reductions in prices as sellers are forced to lower their price to complete a transaction. The problem is magnified when prices decline rapidly. When sellers panic, and are willing to sell “at any price,” the buyers that remain gain almost absolute control over the price they will pay. This “lack of liquidity” for sellers leads to rapid and sharp declines in price, which further exacerbates the problem and escalates until “sellers” are exhausted.
Currently, there is a scarcity of “bears.”
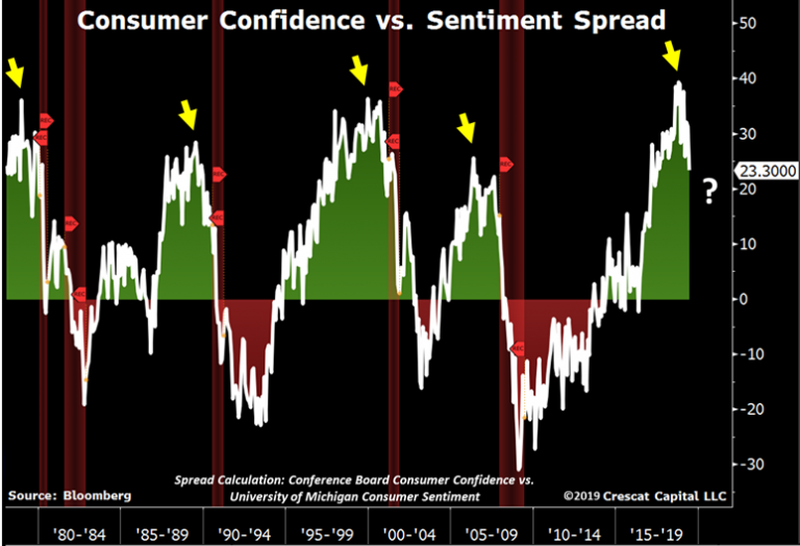
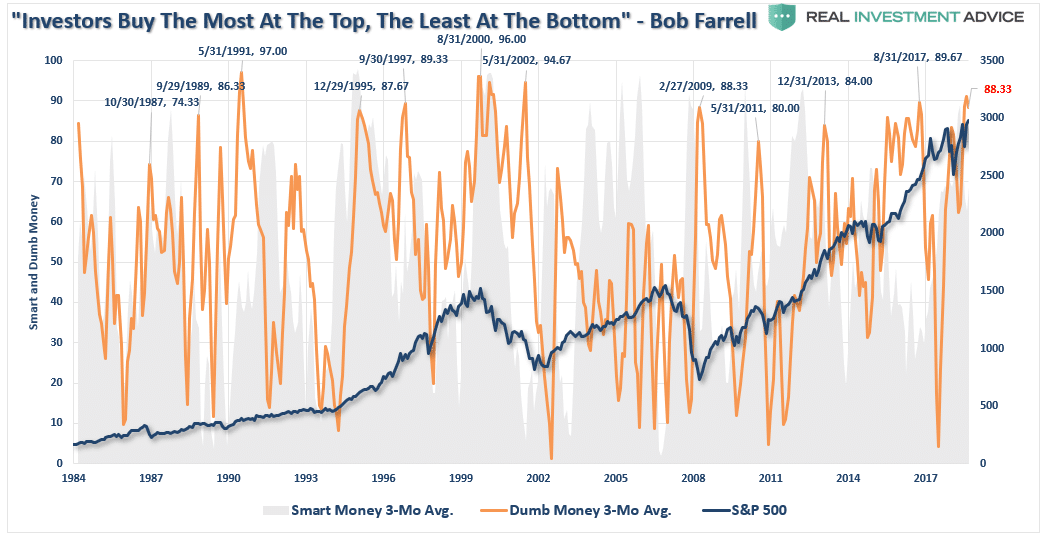
With sentiment currently at very high levels, combined with low volatility and excess margin debt, all the ingredients necessary for a sharp market reversion are present. Am I sounding an “alarm bell” and calling for the end of the known world?
Of course, not.

However, I am suggesting that remaining fully invested in the financial markets without a thorough understanding of your “risk exposure” will likely not have the desirable end result you have been promised. All of the charts above have linkages to each other, and when one goes, they will all go.
So pay attention to the details.
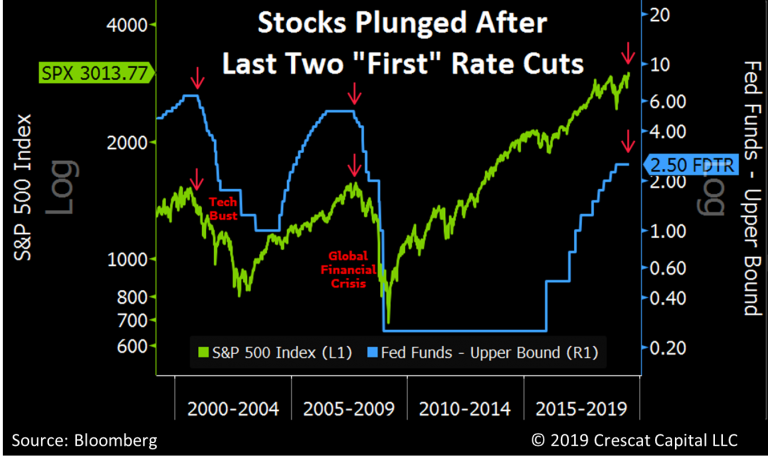
The markets currently believe that when the Fed cuts rates this week, the bull market will continue higher. Crescat, and history, suggest a different outcome.
As I stated above, my job, like every portfolio manager, is to participate when markets are rising. However, it is also my job to keep a measured approach to capital preservation.
Yes, I am bearish on the longer-term outlook of the markets for the reasons, and many more, stated above.
Just make sure you understand that I am an “almost fully invested bear.”
At least for now.
But that can, and will, rapidly change as the indicators I follow dictate.
What’s your strategy?