In last Tuesday’s Technically Speaking post, I stated:
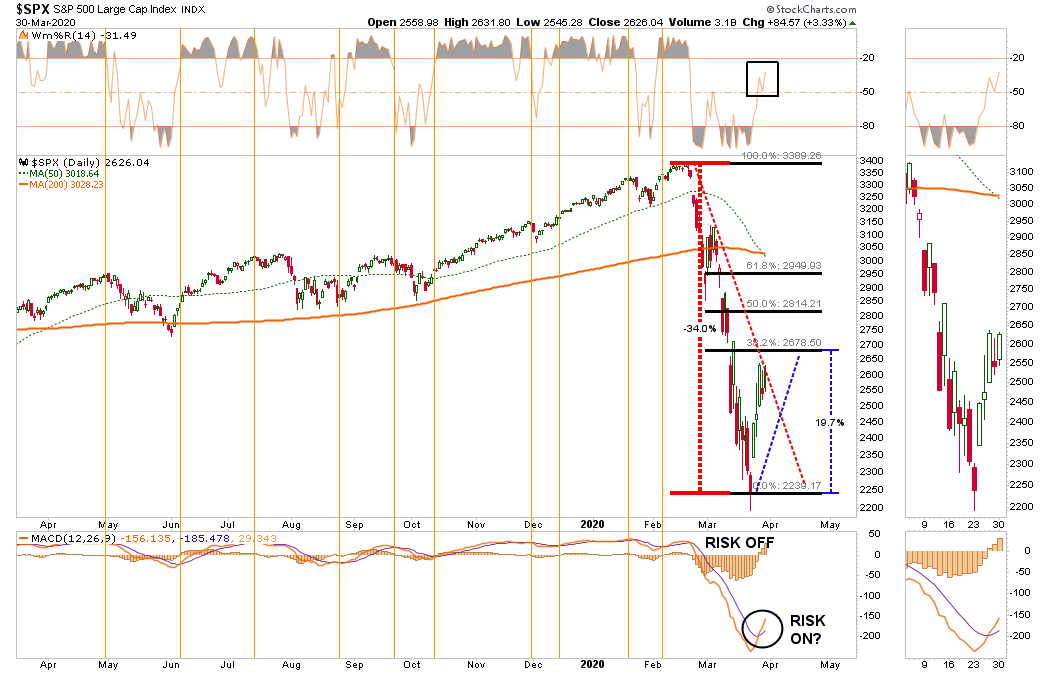
“From a purely technical basis, the extreme downside extension, and potential selling exhaustion, has set the markets up for a fairly strong reflexive bounce. This is where fun with math comes in.
As shown in the chart below, after a 35% decline in the markets from the previous highs, a rally to the 38.2% Fibonacci retracement would encompass a 20% advance.
Such an advance will ‘lure’ investors back into the market, thinking the ‘bear market’ is over.”
Chart Updated Through Monday
Not surprisingly, as we noted in this weekend’s newsletter, the headlines from the mainstream media aligned with our expectations:
So, is the bear market over?
Are the bulls now back in charge?
Honestly, no one knows for certain. However, there are 5-questions that “Market Bulls” need to answer if the current rally is to be sustained.
These questions are not entirely technical, but since “technical analysis” is simply the visualization of market psychology, how you answer the questions will ultimately be reflected by the price dynamics of the market.
Let’s get to work.
Employment
Employment is the lifeblood of the economy. Individuals cannot consume goods and services if they do not have a job from which they can derive income. From that consumption comes corporate profits and earnings.
Therefore, for individuals to consume at a rate to provide for sustainable, organic (non-Fed supported), economic growth they must work at a level that provides a sustainable living wage above the poverty level. This means full-time employment that provides benefits, and a livable wage. The chart below shows the number of full-time employees relative to the population. I have also overlaid jobless claims (inverted scale), which shows that when claims fall to current levels, it has generally marked the end of the employment cycle and preceded the onset of a recession.
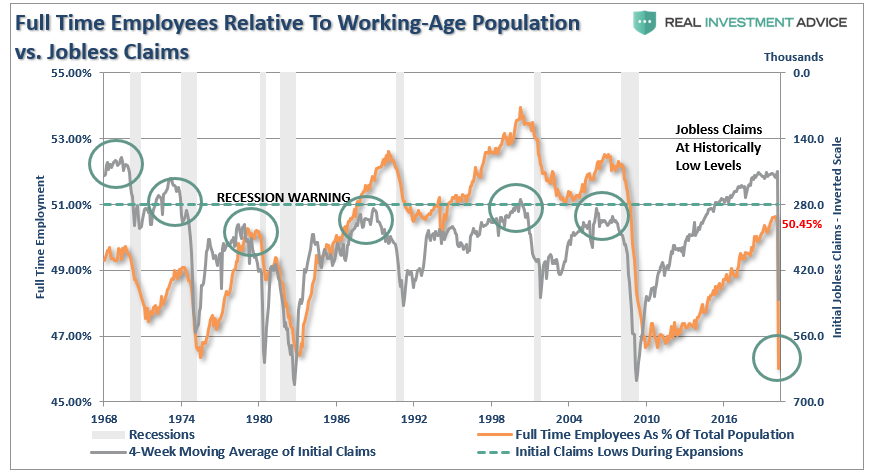
This erosion in jobless claims has only just begun. As jobless claims and continuing claims rise, it will lead to a sharp deceleration in economic confidence. Confidence is the primary factor of consumptive behaviors, which is why the Federal Reserve acted so quickly to inject liquidity into the financial markets. While the Fed’s actions may prop up financial markets in the short-term, it does little to affect the most significant factor weighing on consumers – their job.
Question: Given that employment is just starting to decline, does such support the assumption of a continued bull market?
Personal Consumption Expenditures (PCE)
Following through from employment, once individuals receive their paycheck, they then consume goods and services in order to live.
This is a crucial economic concept to understand, which is the order in which the economy functions. Consumers must “produce” first, so they receive a paycheck, before they can “consume.” This is also the primary problem of Stephanie Kelton’s “Modern Monetary Theory,” which disincentivizes the productive capacity of the population.
Given that Personal Consumption Expenditures (PCE) is a measure of that consumption, and comprises roughly 70% of the GDP calculation, its relative strength has great bearing on the outcome of economic growth.
More importantly, PCE is the direct contributor to the sales of corporations, which generates their gross revenue. So goes personal consumption – so goes revenue. The lower the revenue that flows into company coffers, the more inclined businesses are to cut costs, including employment and stock buybacks, to maintain profit margins.
The chart below is a comparison of the annualized change in PCE to corporate fixed investment and employment. I have made some estimates for the first quarter based on recent data points.
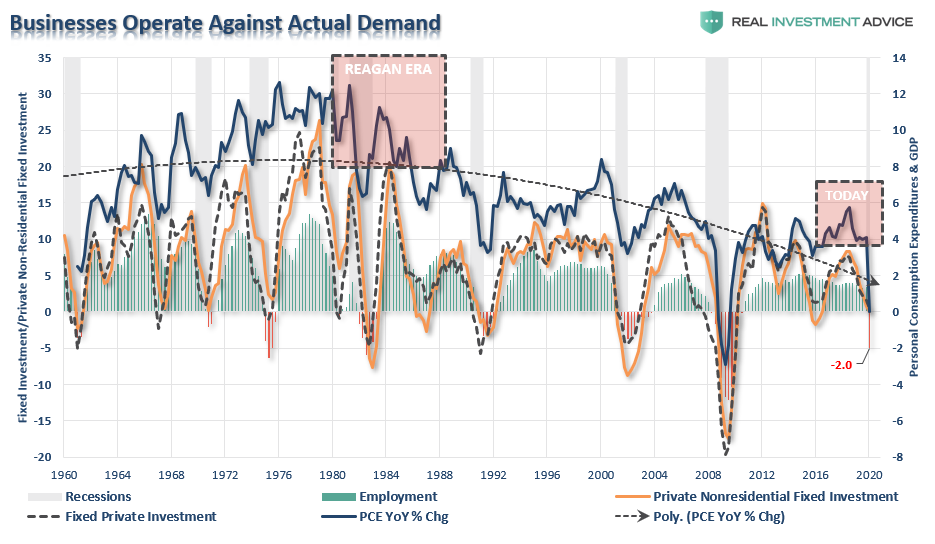
Question: Does the current weakness in PCE and Fixed Investment support the expectations for a continued bull market from current price levels?
Junk Bonds & Margin Debt
While global Central Banks have lulled investors into an expanded sense of complacency through years of monetary support, it has led to willful blindness of underlying risk. As we discussed in “Investor’s Dilemma:”
“Classical conditioning (also known as Pavlovian or respondent conditioning) refers to a learning procedure in which a potent stimulus (e.g. food) is paired with a previously neutral stimulus (e.g. a bell). What Pavlov discovered is that when the neutral stimulus was introduced, the dogs would begin to salivate in anticipation of the potent stimulus, even though it was not currently present. This learning process results from the psychological “pairing” of the stimuli.”
That “stimuli” over the last decade has been Central Bank interventions. During that period, the complete lack of “fear” in markets, combined with a “chase for yield,” drove “risk” assets to record levels along with leverage. The chart below shows the relationship between margin debt (leverage), stocks, and junk bond yields (which have been inverted for better relevance.)
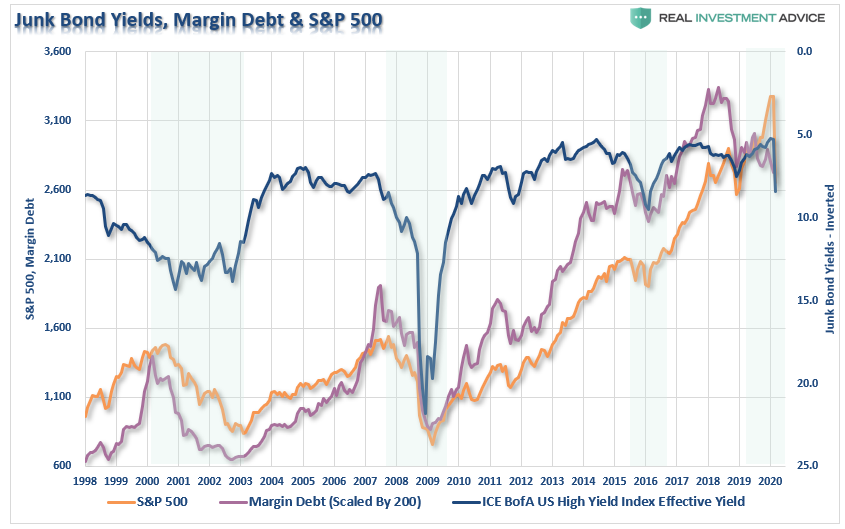
While asset prices declined sharply in March, it has done little to significantly revert either junk bond yields or margin debt to levels normally consistent with the beginning of a new “bull market.”
With oil prices falling below $20/bbl, a tremendous amount of debt tied to the energy space, and the impact the energy sector has on the broader economy, it is likely too soon to suggest the markets have fully “priced in” the damage being done.
Question: What happens to asset prices if more bankruptcies and forced deleveraging occurs?
Corporate Profits/Earnings
As noted above, if the “bull market” is back, then stocks should be pricing in stronger earnings going forward. However, given the potential shakeout in employment, which will lower consumption, stronger earnings, and corporate profits, are not likely in the near term.
The risk to earnings is even higher than many suspect, given that over the last several years, companies have manufactured profitability through a variety of accounting gimmicks, but primarily through share buybacks from increased leverage. That cycle has now come to an end, but before it did it created a massive deviation of the stock market from corporate profitability.
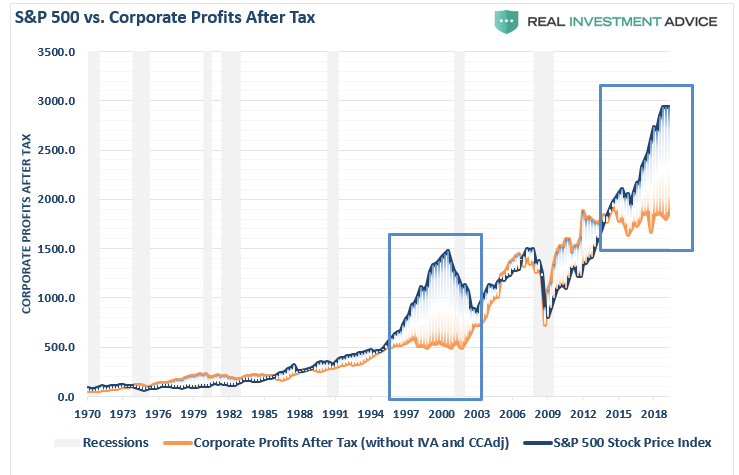
“If the economy is slowing down, revenue and corporate profit growth will decline also. However, it is this point which the ‘bulls’ should be paying attention to. Many are dismissing currently high valuations under the guise of ‘low interest rates,’ however, the one thing you should not dismiss, and cannot make an excuse for, is the massive deviation between the market and corporate profits after tax. The only other time in history the difference was this great was in 1999.”
It isn’t just the deviation of asset prices from corporate profitability, which is skewed, but also reported earnings per share.
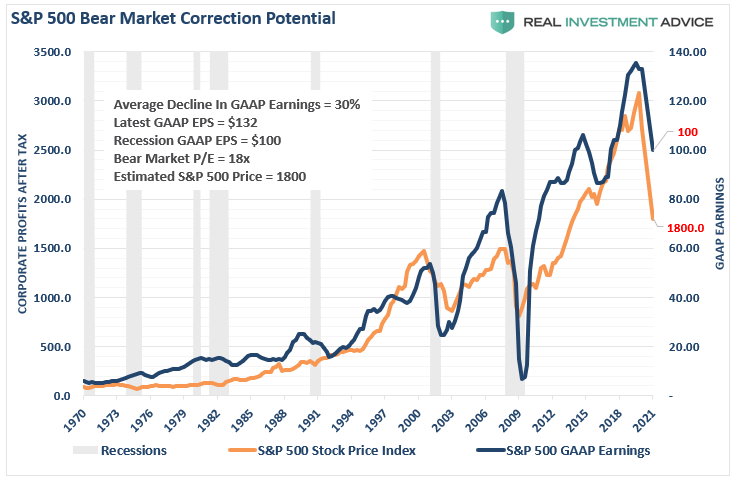
The impending recession, and consumption freeze, is going to start the mean-reversion process in both corporate profits, and earnings. I have projected the potential reversion in the chart below. The reversion in GAAP earnings is pretty calculable as swings from peaks to troughs have run on a fairly consistent trend.
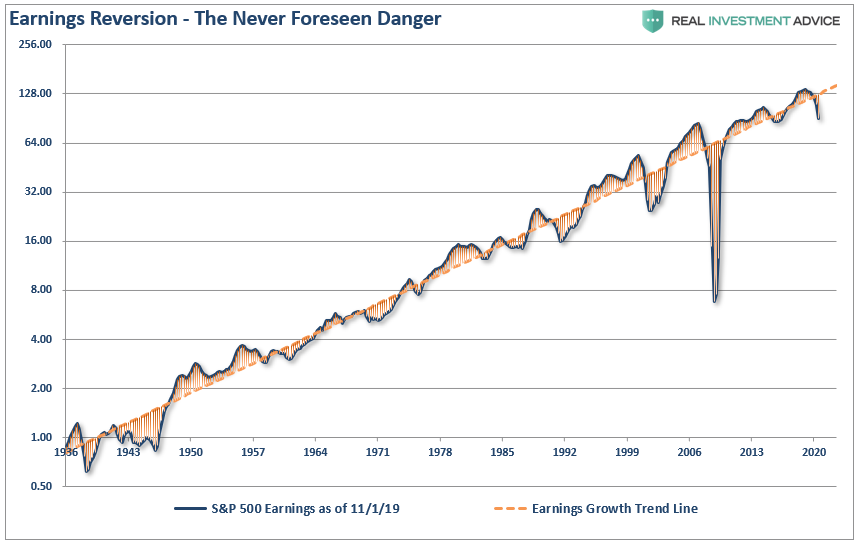
Using that historical context, we can project a recession will reduce earnings to roughly $100/share. (Goldman Sachs currently estimates $110.) The resulting decline asset prices to revert valuations to a level of 18x (still high) trailing earnings would suggest a level of 1800 for the S&P 500 index. (Yesterday’s close of 2626 is still way to elevated.)
The decline in economic growth epitomizes the problem that corporations face today in trying to maintain profitability. The chart below shows corporate profits as a percentage of GDP relative to the annual change in GDP. The last time that corporate profits diverged from GDP, it was unable to sustain that divergence for long. As the economy declines, so will corporate profits and earnings.
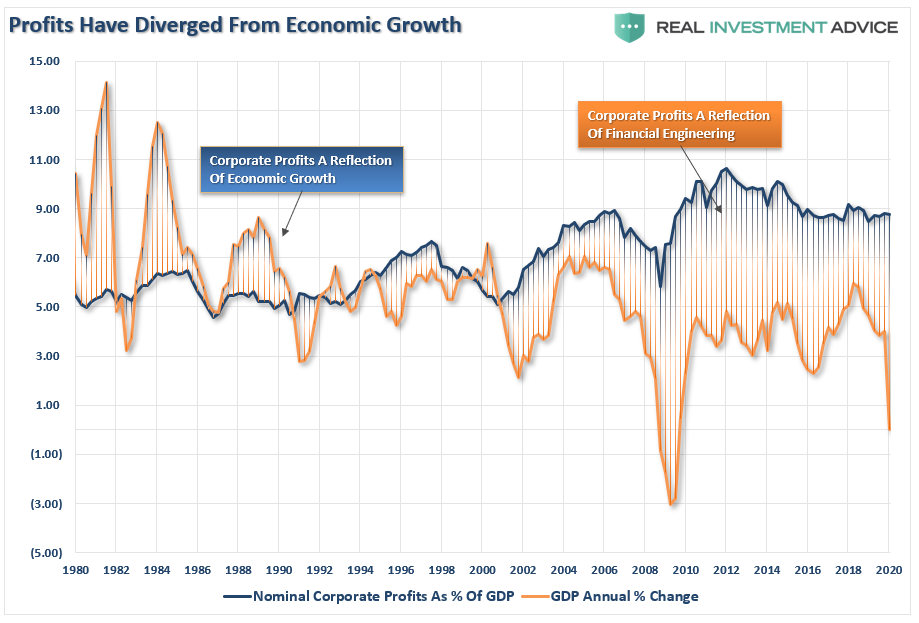
Question: How long can asset prices remain divorced from falling corporate profits and weaker economic growth?
Technical Pressure
Given all of the issues discussed above, which must ultimately be reflected in market prices, the technical picture of the market also suggests the recent “bear market” rally will likely fade sooner than later. As noted above”
“Such an advance will ‘lure’ investors back into the market, thinking the ‘bear market’ is over.”
Importantly, despite the sizable rally, participation has remained extraordinarily weak. If the market was seeing strong buying, as suggested by the media, then we should see sizable upticks in the percent measures of advancing issues, issues at new highs, and a rising number of stocks above their 200-dma.
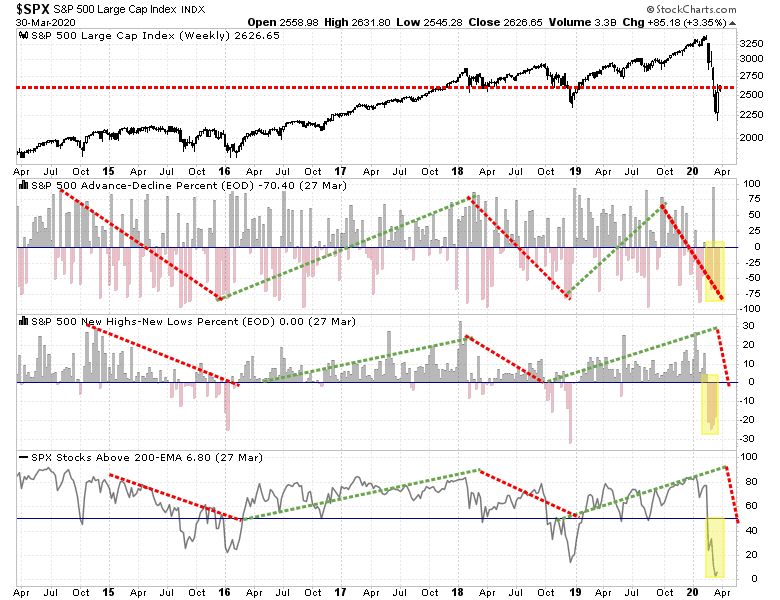
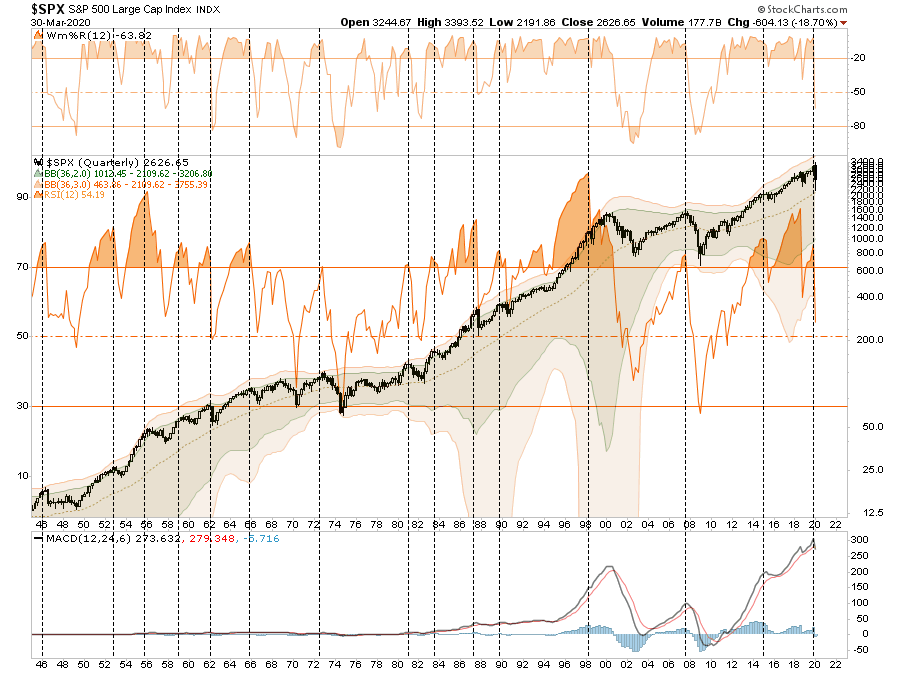
However, on a longer-term basis, since this is the end of the month, and quarter, we can look at our quarterly buy/sell indication which has triggered a “sell” signal for the first time since 2015. While such a signal does not demand a major reversion, it does suggest there is likely more risk to the markets currently than many expect.
Question: Does the technical backdrop currently support the resumption of a bull market?
There are reasons to be optimistic on the markets in the very short-term. However, we are continuing to extend the amount of time the economy will be “shut down,” which will exacerbate the decline in the unemployment and personal consumption data. The feedback loop from that data into corporate profits and earnings is going to make valuations more problematic even with low interest rates currently.
While Central Banks have rushed into a “burning building with a fire hose” of liquidity, there is the risk that after a decade of excess debt, leverage, and misallocation of assets, the “fire” may be too hot for them to put out.
Assuming that the “bear market” is over already may be a bit premature, and chasing what seems like a “raging bull market” is likely going to disappoint you.
Bear markets have a way of “suckering” investors back into the market to inflict the most pain possible. This is why “bear markets” never end with optimism, but in despair.