In this past weekend’s newsletter, I discussed the rather severe extensions of the market above both the longer-term bullish trend and the 200-dma. To wit:
“Currently, it will likely pay to remain patient as we head into the end of the year. With a big chunk of earnings season now behind us, and economic data looking weak heading into Q4, the market has gotten a bit ahead of itself over the last few weeks.
On a short-term basis, the market is now more than 6% above its 200-dma. These more extreme price extensions tend to denote short-term tops to the market, and waiting for a pull-back to add exposures has been prudent..”

But it isn’t just the more extreme advance of the market over the past 5-weeks which has us a bit concerned in the short-term, but a series of other indications which typically suggest short- to intermediate-terms corrections in the market.
Not surprisingly, whenever I discuss the potential of a market correction, it is almost always perceived as being “bearish.” Therefore, by extension, such must mean I am either all in cash or shorting the market. In either case, it is assumed I “missed out” on the previous advance.
If you have been reading our work for long, you already know we have remained primarily invested in the markets, but hedge our risk with fixed income and cash, despite our “bearish” views. I am reminded of something famed Morgan Stanley strategist Gerard Minack said once:
“The funny thing is there is a disconnect between what investors are saying and what they are doing. No one thinks all the problems the global financial crisis revealed have been healed. But when you have an equity rally like you’ve seen for the past four or five years, then everybody has had to participate to some extent.
What you’ve had are fully invested bears.”
While the mainstream media continues to misalign individual’s expectations by chastising them for “not beating the market,” which is actually impossible to do, the job of a portfolio manager is to participate in the markets with a preference toward capital preservation. This is an important point:
“It is the destruction of capital during market declines that have the greatest impact on long-term portfolio performance.”
It is from that view, as a portfolio manager, the idea of “fully invested bears” defines the reality of the markets that we live with today. Despite this understanding, the markets are overly bullish, extended, and overvalued and portfolio managers must stay invested or suffer potential “career risk” for underperformance. What the Federal Reserve’s ongoing interventions have done is push portfolio managers to chase performance despite concerns of potential capital loss.
Managing portfolios for both risk adjusted returns while protecting capital is a delicate balance. Each week in the Real Investment Report (click here for free weekly e-delivery) we discuss the risks and challenges of the current market environment and report on how we are adjusting our exposures to the market over time.
In this past weekend’s missive, we discussed how to “play” the latest round of the Fed’s QE program, along with what sectors and markets tend to perform the best.
However, I wanted to share a few charts which suggests that being patient currently, will likely yield a much better entry point for investors in the not-so-distant future.
Overbought And Extended
By the majority of measures that we track from momentum, to price, and deviation, the market’s sharp advance has pushed the totality of those indicators back to overbought.
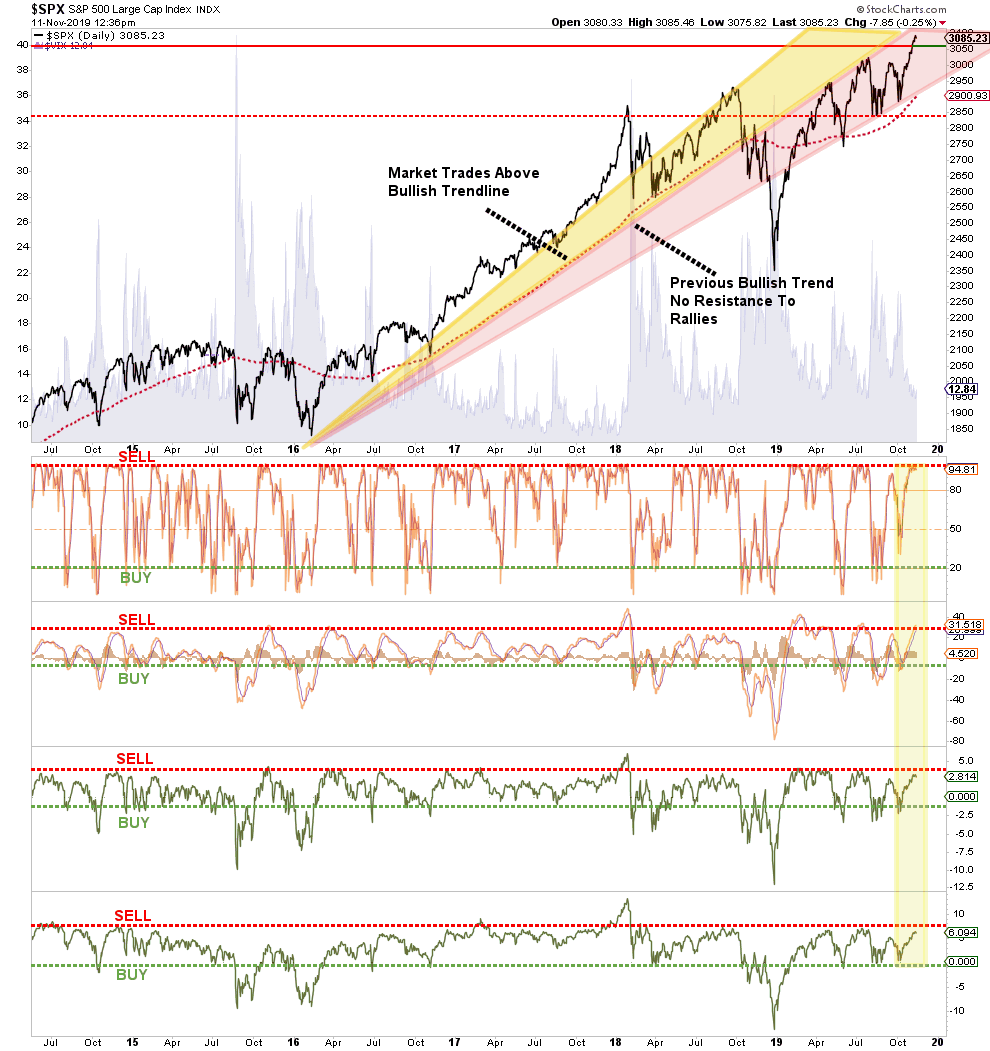
Historically, when all of the indicators are suggesting the market has likely encompassed the majority of its price advance, a correction to reverse those conditions is often not far away. Regardless of the timing of that correction, it is unlikely there is much upside remaining in the current advance, and taking on additional equity exposure at these levels will likely yield a poor result.
Overly Complacent
The post-Fed rate cut and QE driven advance in the market has also pushed investors back to levels of extreme complacency.
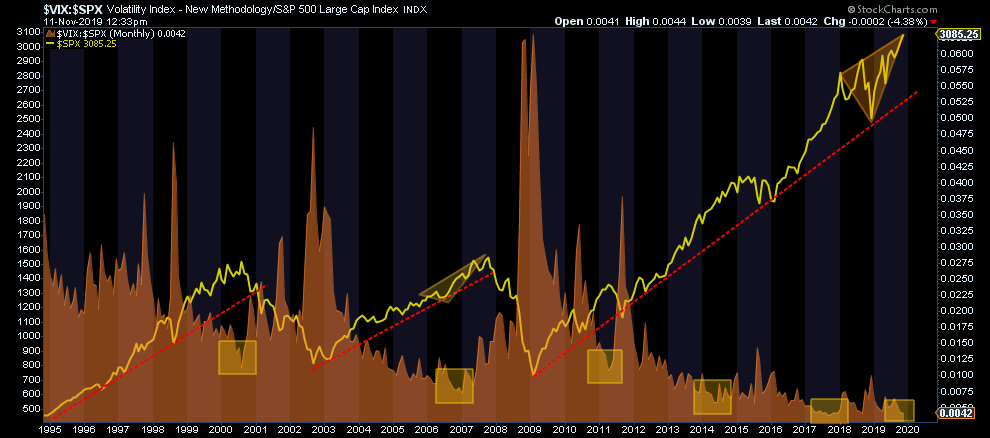
Such extremely low levels of volatility, combined with investors piling into record “short positions” on the VIX, provides all the “fuel” necessary for a fairly sharp 3-5% correction given the proper catalyst.
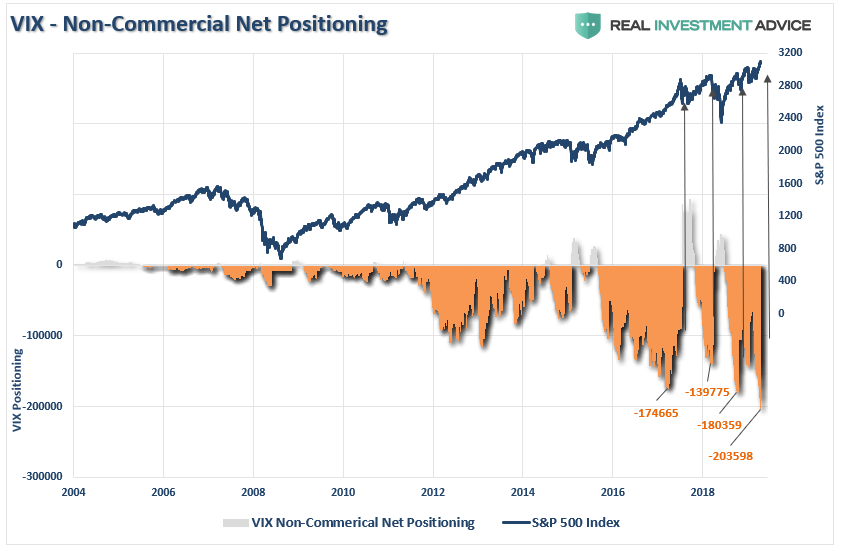
Given that investors are “all in,” as discussed last week, there is plenty of room for investors to get forced out of holdings and push markets lower over the next few weeks. However, it isn’t just individual investors that are “all in,” but professionals as well.
Eurodollar Sends A Warning
Eurodollar positioning is also sending a major warning. (“Eurodollar” refers to U.S. dollar-denominated deposits at foreign banks, or at the overseas branches of American banks.)
When the ECB launched QE following the 2016 selloff, foreign banks liquidated Eurodollar deposits as it was deemed less risky to hold foreign denominated deposits. Currently, that view has reversed sharply as the global economy slows, and foreign banks are “hedging” their risk by flooding money into U.S. dollar denominated deposits. Historically, when you have an extremely sharp reversal in Eurodollars, it has preceded more troubling market events.
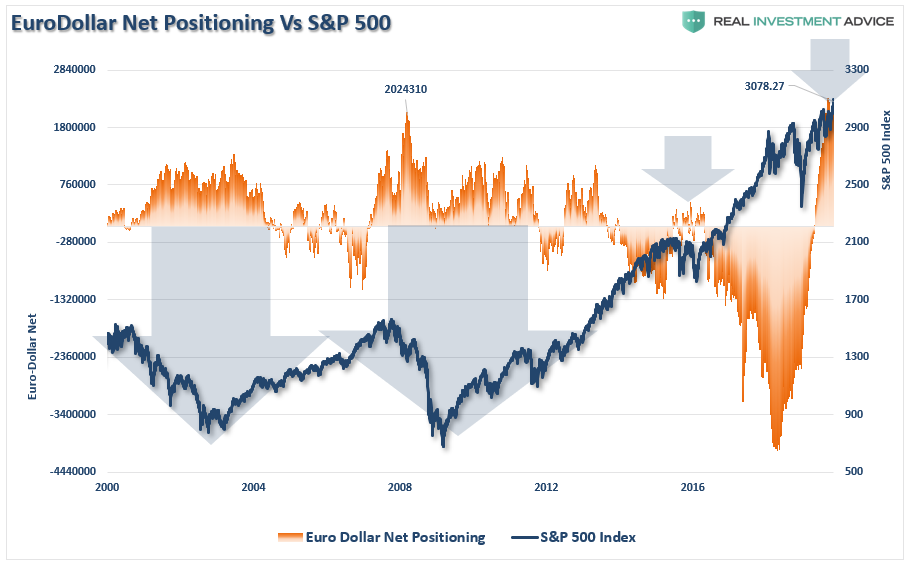
With Eurodollar deposits at record levels, do foreign banks know something we don’t?
Earnings Vs. Profits
The deviation between corporate GAAP earnings and corporate profits is currently at record levels. It is also entirely unsustainable. Either corporate profits will catch up with earnings, or vice-versa. Historically, profits have never caught up with earnings, it is always the other way around.
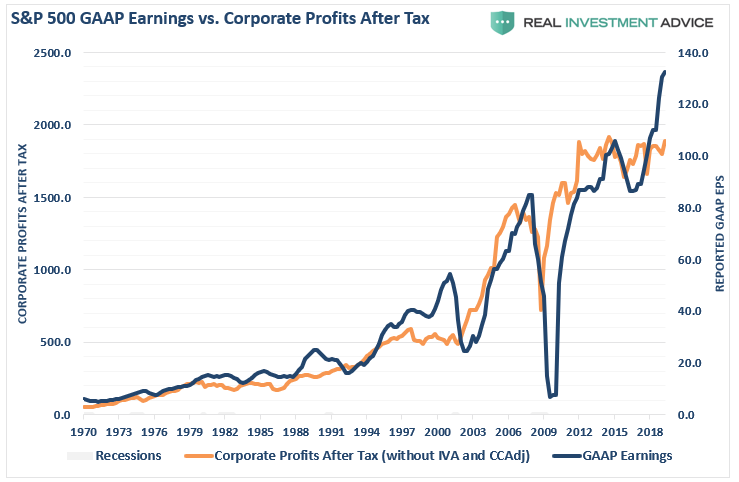
Expectations for corporate earnings going forward are still way to elevated, and with corporate share buybacks slowing, this leaves lots of room for disappointment.
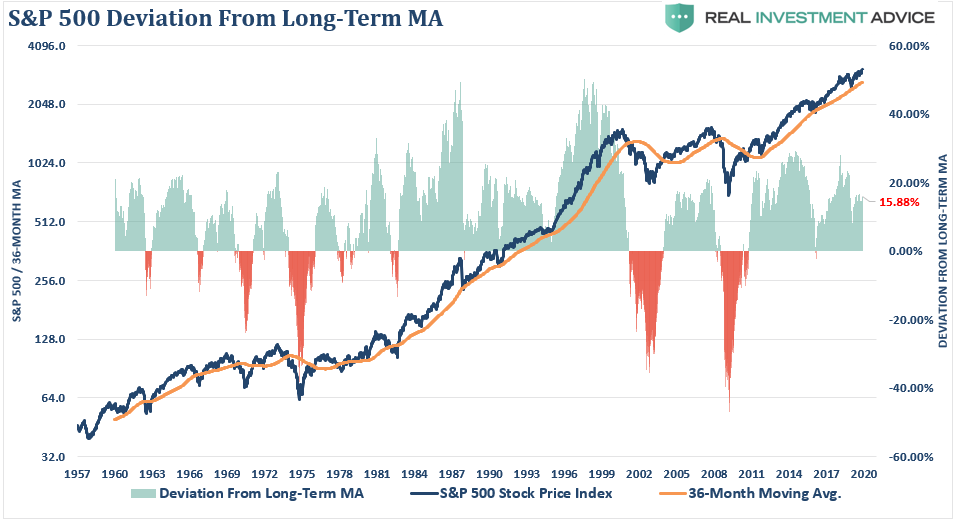
Deviation
I have written many times in the past that the financial markets are not immune to the laws of physics.
There is a simple rule for markets:
“What goes up, must, and will, eventually comes down.”
The example I use most often is the resemblance to “stretching a rubber-band.” Stock prices are tied to their long-term trend which acts as a gravitational pull. When prices deviate too far from the long-term trend they will eventually, and inevitably, “revert to the mean.”
Currently, the market is not only more than 6% above its 200-dma, as shown in the opening of this missive, but is currently more than 15% above its 3-year moving average.
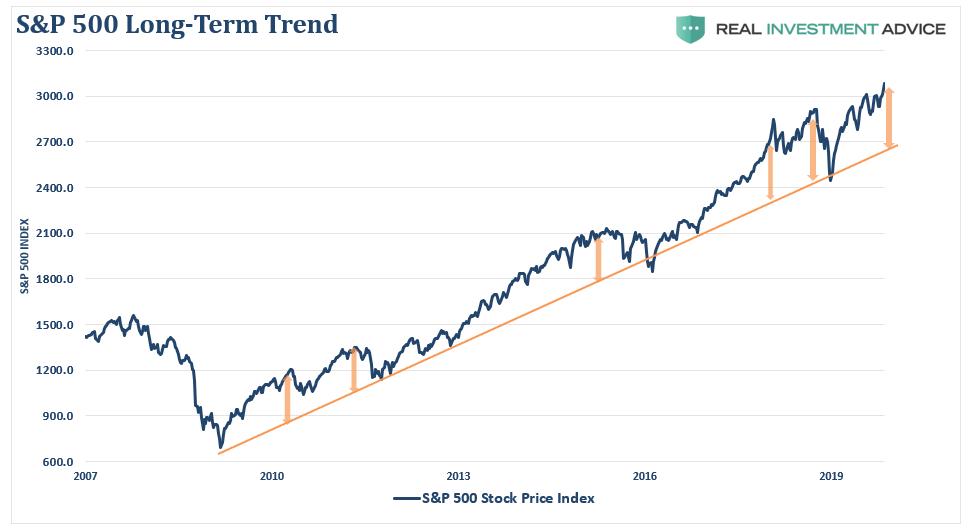
More importantly, the market is currently extremely deviated above it long-term bullish trend. During this entire decade-long bull market advance, the trendline is retested with some regularity from such extreme extensions.
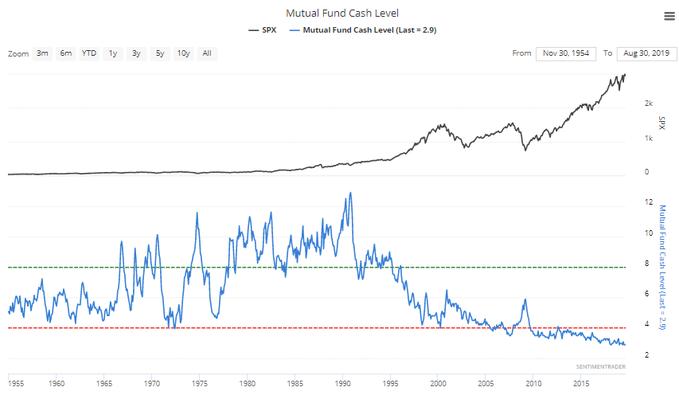
Sentiment
Lastly, is sentiment. When sentiment is heavily skewed toward those willing to “buy,” prices can rise rapidly and seemingly “climb a wall of worry.” However, the problem comes when that sentiment begins to change and those willing to “buy” disappear.
This “vacuum” of buyers leads to rapid reductions in prices as sellers are forced to lower their price to complete a transaction. The problem is magnified when prices decline rapidly. When sellers panic, and are willing to sell “at any price,” the buyers that remain gain almost absolute control over the price they will pay. This “lack of liquidity” for sellers leads to rapid and sharp declines in price, which further exacerbates the problem and escalates until “sellers” are exhausted.
Currently, there is a scarcity of “bears.”
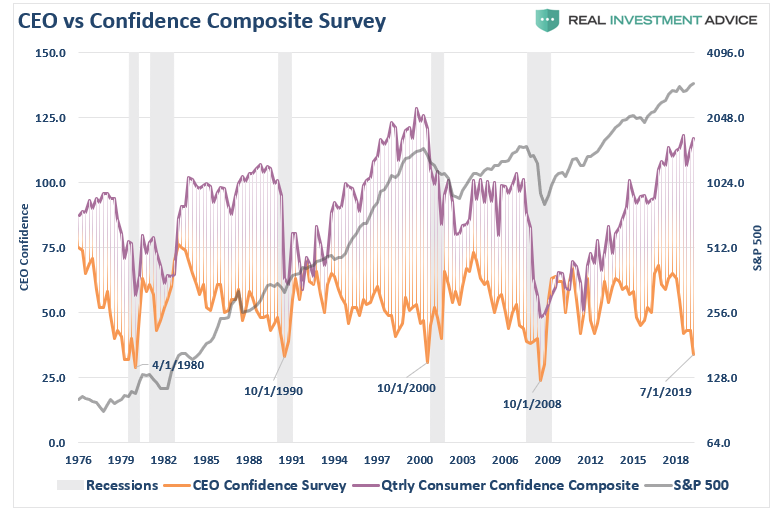
As we discussed just recently, consumer and investor confidence are both closely tied and are extremely elevated. However, CEO confidence is pushing record lows. A quick look at history shows this level of disparity is not unusual around market peaks and recessionary onsets.
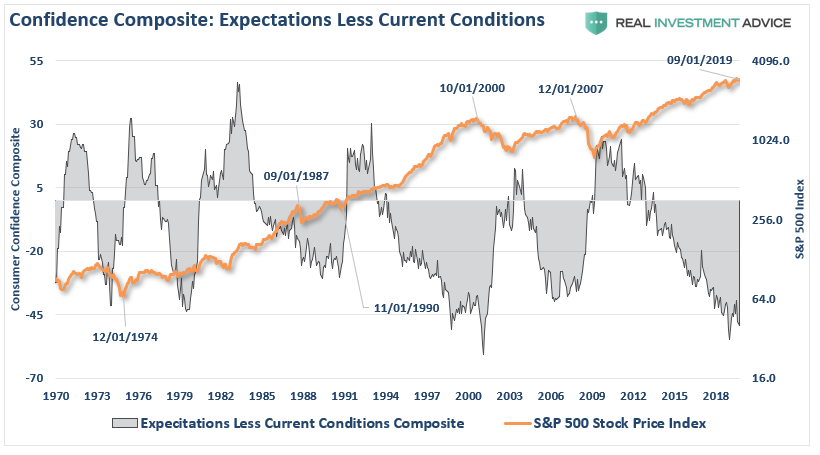
Another way to analyze confidence data is to look at the consumer expectations index minus the current situation index in the consumer confidence report.
This measure also is signaling a correction/recession is coming. The differential between expectations and the current situation, as you can see below, is worse than the last cycle, and only slightly higher than prior to the “dot.com” crash. Recessions start after this indicator bottoms, which has already started happening.
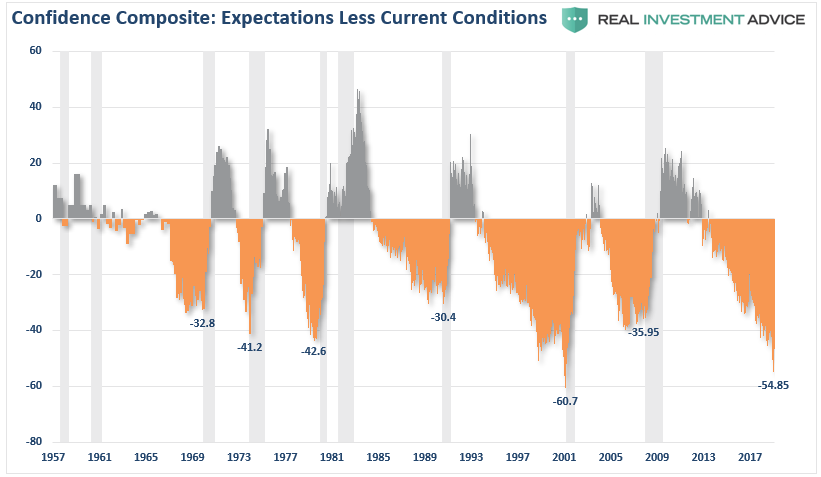
Currently, the bottoming process, and potential turn higher, which signals a recession and bear market, appears to be in process.
None of this should be surprising as we head into 2020. With near-record low levels of unemployment and jobless claims, combined with record high levels of sentiment, job openings, and record asset prices, it seems to be just about as “good as it can get.”
Does this mean the current bull market is over?
No.
However, it does suggest the “risk” to investors is currently to the downside, and some caution with respect to equity-based exposure should be considered.
What Are We Doing About It?
Given the fact that the short, intermediate, and long-term indicators have all aligned, the risk of running portfolios without a hedge is no longer optimal. As such, we added an “inverse” S&P 500 position to all of our portfolios late yesterday afternoon.
While none of the charts above necessarily mean the next “great bear market” is coming, they do suggest a modest correction is likely. The reason we hedge against declines is that one day, and we never know when, a modest correction will turn into a more significant decline.
Remaining fully invested in the financial markets without a thorough understanding of your “risk exposure”will likely not have the desirable end result you have been promised. All of the charts above have linkages to each other, and when one breaks, they all break.
So pay attention to the details.
As I stated above, my job, like every portfolio manager, is to participate when markets are rising. However, it is also my job to keep a measured approach to capital preservation.
SO, why shouldn’t you show these charts to the bulls?
Because you need someone to “sell to” first.