I recently received the following email:
“Are we going to hit new highs you think, or is this a setup for the real correction?”
The answer is “yes” to both parts.
Thank you for reading. See you next week.
You still here?
Fine, let me explain then.
The “price” of the financial markets are ultimately driven by one thing and one thing only: “expectations.”
Yes, fundamentals, valuations, interest rates, etc. all play an important role, but it is ultimately “expectations” of “the herd” which moves prices. Currently, valuations on stocks are at the second highest level on record, but “expectations” are that a continued “low interest rate environment” can support economic growth allowing stocks to “grow” into their valuations.
This is why Wall Street begin using “forward operating earnings,” which are complete nonsense, to justify high valuations and, you guessed it, “expectations.” (Operating earnings are essentially “made up” earnings without any of the “bad stuff” included.)
For more on this valuation read a recent article we wrote on the topic titled Price to Forecasted Hope.
The problem, historically speaking, is when those “expectations” are disappointing as shown below. There are three important things worth pointing out:
- The top panel is GAAP earnings (what companies REALLY earn) and nominal GDP.
- The black vertical line is when the markets begin to “sniff out” something is quite right.
- The red bars are when “expectations” are disappointed.
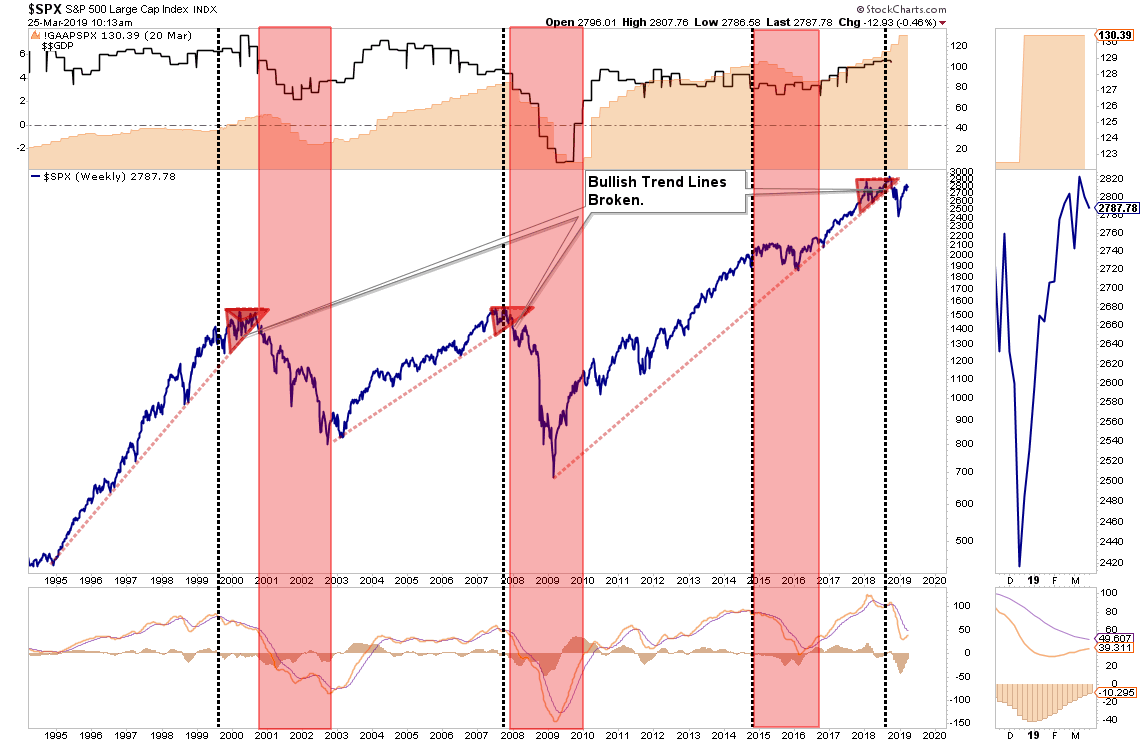
While “expectations” were indeed disappointing in 2015-2016, the long-term rising trend line was never violated. Secondly, the current warning signal (black vertical line) is in place, but “expectations” have not yet been disappointed.
As I discussed yesterday, one of the biggest problems facing investors is that many have never recovered from the previous two bear markets. While “this time may seem different,” the reality is such is probably not the case.
Let’s review the periods just prior to the onset of the last two bear markets to see if there are any similarities to today’s environment.
1998-2000
Leading up to 2000, the Internet was changing the world. Companies like E*Trade brought investing to the mainstream public and now everybody was a “professional investor.” Despite silly little hiccups like Long-Term Capital Management and the “Asian Contagion,” the markets rocketed higher as expectations were that “clicks per page” had changed the investing dynamic forever. “Buy the dip,” and “Buy and hold” were the investing mantras of the day as retail investors loaded up on risk.
The economy was strong, employment was high, and corporate earnings were soaring as the advent of “operating, or proforma, earnings” established its place in the Wall Street lexicon. It’s was, for all intents and purposes, a “new era.”
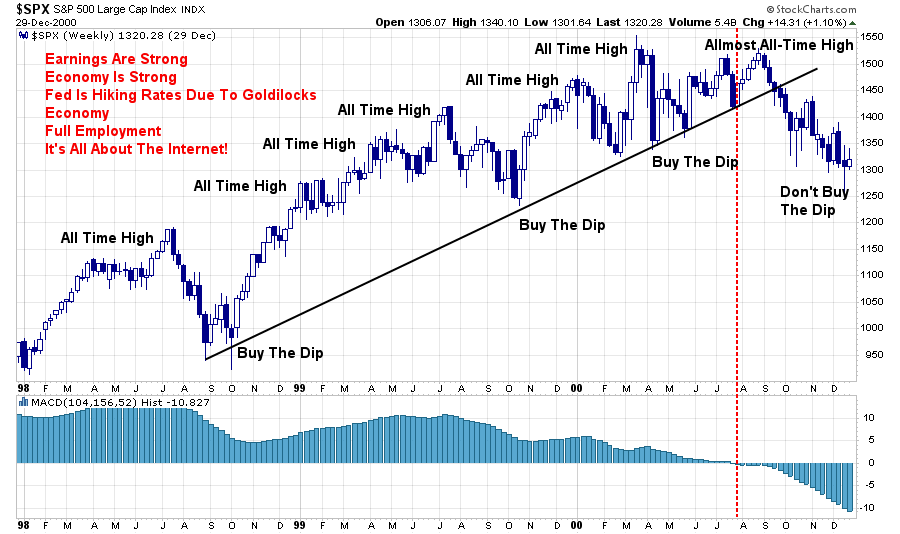
The change came in late July of 2000 as stocks recovered from previous dips but failed to reach new highs. The deterioration in price momentum was signaling that something was changing as the Fed had been aggressively tightening monetary policy. By December of 2000, the “buy the dip” mantra and “buy and hold” investing were no more.
The “all-time” high printed in 2000 would not be seen again for 7-years.
2006-2008
Fast forward to 2006. After the crushing of investors portfolios from 2000-2002, much of the damage had been corrected.
“See, if you had just bought and held, you would be fine.”
“Buy and hold” and “dollar cost averaging” investment strategies had once again returned to the media headlines. With mortgage rates low and a litany of no cost/low-cost options for getting a mortgage, or using the mortgage as an A.T.M., Wall Street had found a new avenue for liquidity in the “real estate market.”
Once again it seemed as if nothing could go wrong as the flood of liquidity in the system allowed for asset prices to rise. As the market consistently rang out new highs through 2006 and 2007, it was believed once again this “time was different.”
Even when small west coast banks and two Bear Stearn’s hedge funds collapsed due to their investments in risky “mortgage-backed” instruments, it was quickly ignored by investors as then Fed Reserve Chairman Ben Bernanke soothed the markets with docile tones of a “Goldilocks Economy.”
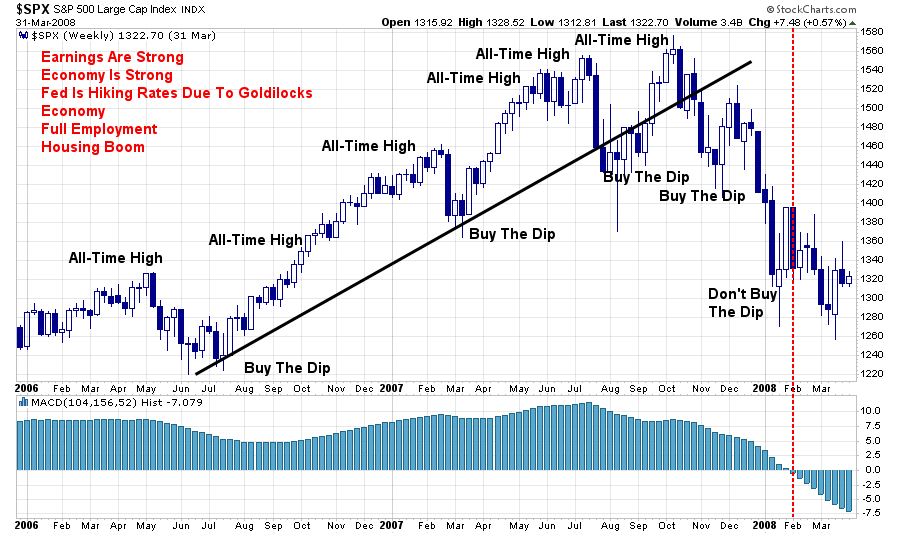
After a stumble in July of 2007, the market came roaring back, ignoring the growing mortgage and real-estate issues and surged back to hit all-time highs.
That was the last all-time high that would be seen for another 6-years.
2017-Present
Of course, there are many investors, and more importantly financial advisors, who were not in the markets during those previous two periods. Many individuals simply sold out of the markets, or lost most everything, and never returned. Many financial advisors quit the business and started a different profession.
So, for many the bull market of the last decade seems to be “normal.” Once again, “buy the dip” and “buy and hold”are once again “a thing.” More importantly, “this time is different” because the “Central Banks have the market’s back.”
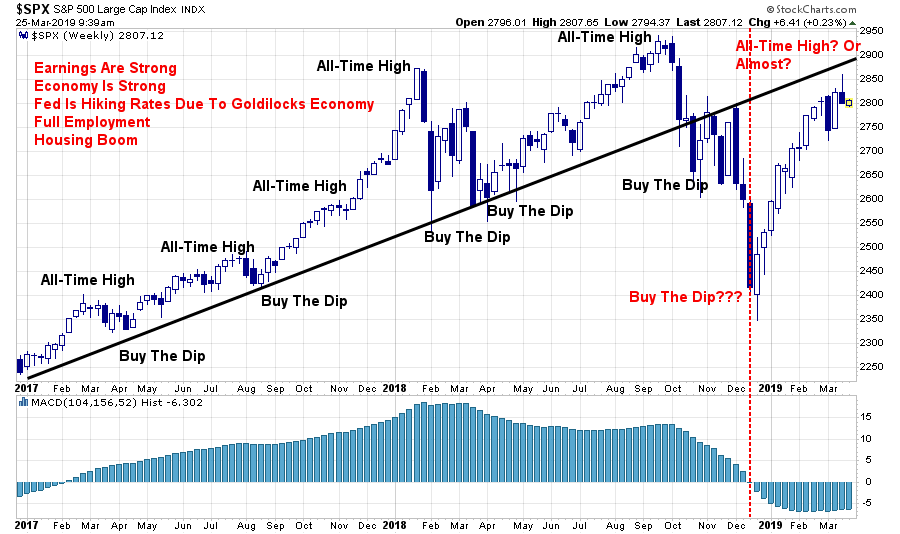
But is it?
In reviewing the chart above, there are certainly many similarities between the current market backdrop and those previous bull market peaks. There are also an abundance of risks which Doug Kass noted on Monday:
“I continue to be of the view that 2018 marked the beginning of the end of the 10-year Bull Market and that an important top was in the process of being established last year.
‘Tops are a process, bottoms are an event.’
Consider the following fundamentally based issues and concerns I raised back then (and that still have value, and have been updated in boldface):
- Downside Risk Dwarfs Upside Reward.
- Global Growth Is Less Synchronized .
- FAANG’s Dominance Represents an Ever-Present Risk.
- Market Structure Is One-Sided and Worrisome. Machines and algorithms rule the day; they, too, are momentum-based on the same side of the boat.
- Higher Interest Rates Not Only Produce a More Attractive Risk-Free Rate of Return, They Also Make It Hard for the Private and Public Sectors to Service Debt.
- Trade Tensions With China Are Intensifying and Mr. Market Is Improperly Looking Past Marginal Risks.
- Any Semblance of Fiscal Responsibility Has Been Thrown Out the Window by Both Political Parties. This has very bad ramifications, which shortly may be discounted in lower stock prices, especially as it relates to the servicing of debt — a subject I have written about often.
- Peak Buybacks. Buybacks continue apace, but look who’s selling.
- China, Europe and the Emerging Market Economic Data All Signal a Slowdown. It’s in the early innings of such a slowdown based on any real-time analysis of the economic data.
“Confronted with a challenge to distill the secret of sound investment into three words, we venture the motto, Margin of Safety.” – Benjamin Graham
He is correct.
However, while the “risks” are abundant, they don’t matter until they do. As I noted in last week’s Technical Update:
“The ‘animal spirits,’ which were awakened by consecutive rounds of financial stimulus on a global scale, has enticed investors into the belief that all risks of a market cycle completion have been removed. The problem, as I have discussed previously, is this optimism comes at a point in history diametrically opposed to when President Reagan instituted many of the same conservative policies.
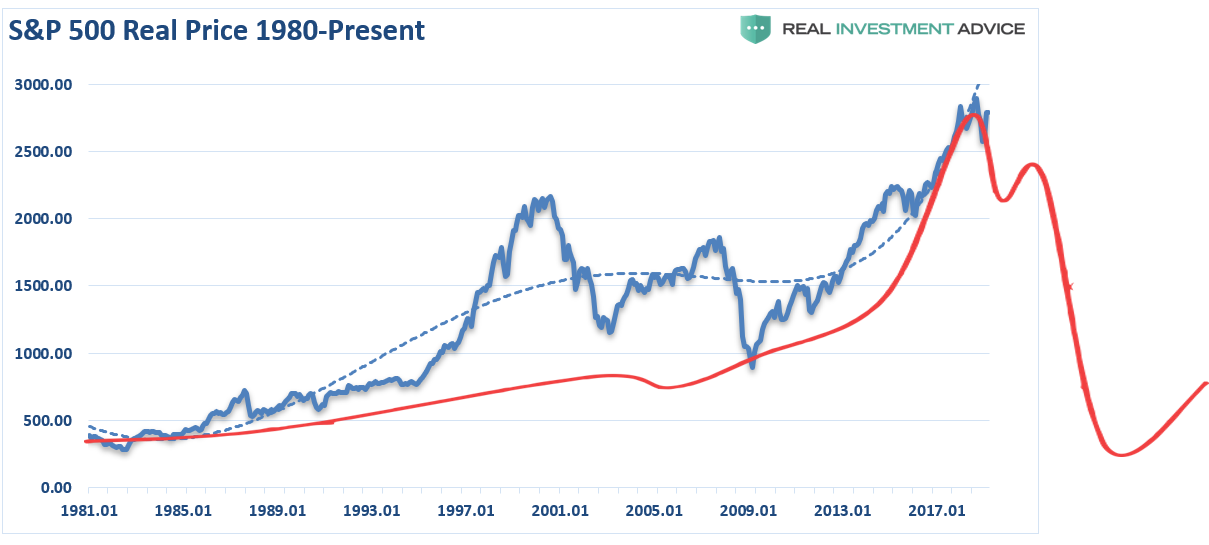
It is this exuberance that reminded me of the following ‘investor psychology’ chart.”
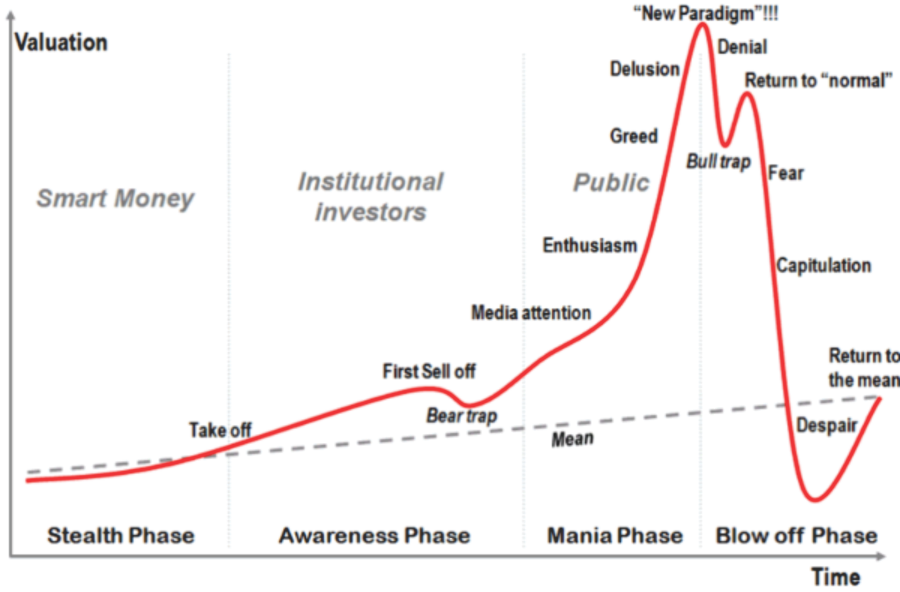
“The third (current) full-market cycle is only 39-years in the making. Given the 2nd highest valuation levels in history, corporate, consumer and margin debt near historical highs, and average economic growth rates running at historical lows, it is worth questioning whether the current full-market cycle has been completed or not?”
As Doug concluded:
“The search for value and comparing it to risk taken is, at its core, the marriage of a contrarian streak and a calculator.
While it is important to gauge the possibility (based on fundamental and technical input) that the market may be making an important market top, it is even more important to distill, based on reasonable fundamental input, what the market’s reward versus risk is. This calculus and taking advantage of the discrepancy between price and intrinsic value trumps everything else that I do in determining market value.
My investment process points me to conclude that, at current prices, downside risk substantially eclipses upside reward.”
This was the case in 1999 and 2007 as well.
The “Goldilocks economy,” the “permanently high plateau,” and “buy and hold” all died at the altar of price reversions.
And, the answer is “YES.”
- Yes, the markets could absolutely rally to, or near, all-time highs.
- It could also well be the last “all-time” high you see for the next 6-10 years.