by
One of the interesting aspects of “bull markets” is the further they go, the lower forward returns fall. In hindsight, such an idea seems counter-intuitive, but ultimately it always comes down to valuations. As Warren Buffett once quipped: “Price is what you pay. Value is what you get.”
(Click Here To Read Why Low Returns Requires A Bear Market)
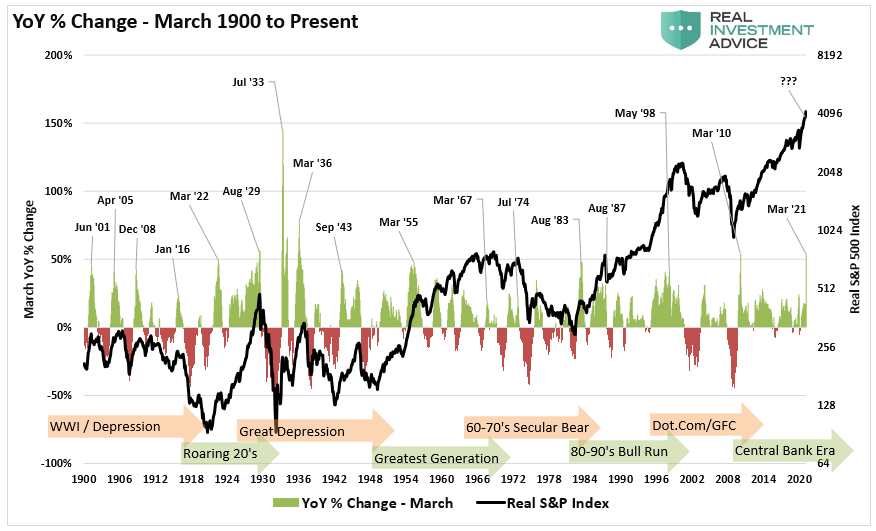
When markets are incredibly exuberant, as they are currently, it is not surprising that such is commonly associated with previous market peaks. The chart below shows the annual rate of change of the inflation-adjusted S&P 500 index from March to March. The recent market surge marks one of the largest on record. Such increases typically preceded corrections (10-20%) to outright bear markets.
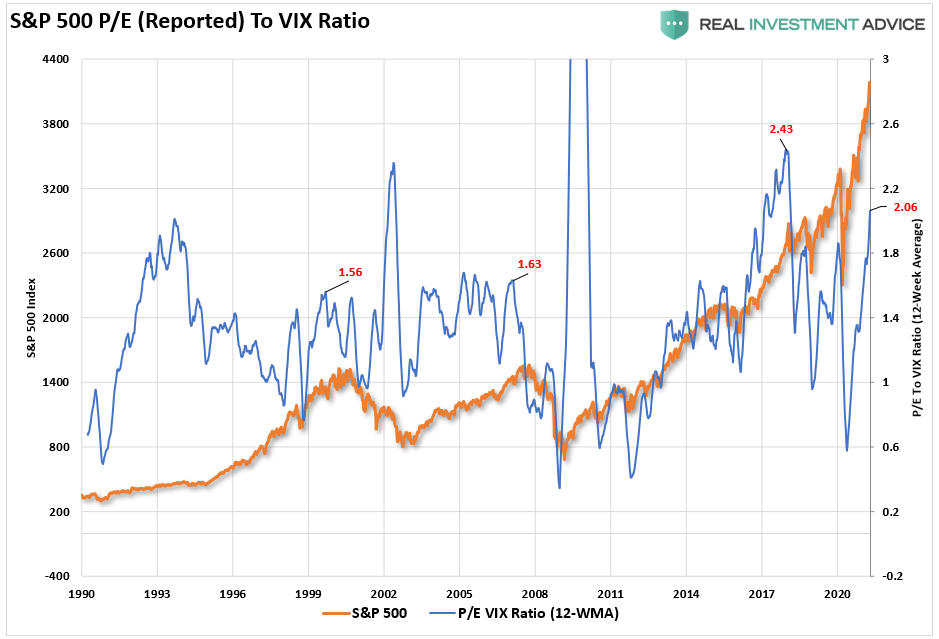
As we will discuss momentarily, a look at GAAP valuations as a ratio to the “Volatility Index” also finds potential “Trouble in Paradise.”
However, despite these more basic understandings, investors still cling to the belief “this time is different.” To support that thesis, investors have pointed to low interest rates as support for excess valuations.
But does that theory hold?
Low-Interest Rates & Forward Returns
We previously discussed whether low rates justified high valuations, to wit:
“The primary argument is that when inflation or interest rates fall, the present value of future cash flows from equities rises, and subsequently, so should their valuation. While true, assuming all else is equal, a falling discount rate does suggest a higher valuation. However, when inflation declines, future nominal cash flow from equities also falls, this can offset the effect of lower discount rates. Lower discount rates are applied to lower expected cash flows.
In other words, without adjusting for inflation and, in no small degree, economic growth, suggesting low rates justify overpaying for cash flows is a very flawed premise.”
Or, as Cliff Asness of AQR Capital confirmed:
“Instead of regarding stocks as a fixed-rate bond with known nominal coupons, one must think of stocks as a floating-rate bond whose coupons will float with nominal earnings growth. The stock market’s P/E is like the price of a floating-rate bond. In most cases, despite moves in interest rates, the price of a floating-rate bond changes little, and likewise the rational P/E for the stock market moves little.”
In other words, if you are going to discount the “P” due to low rates, you also have to discount the “E” as well. Before we get to “earnings yield,” a look at the history of interest rates can tell us something.
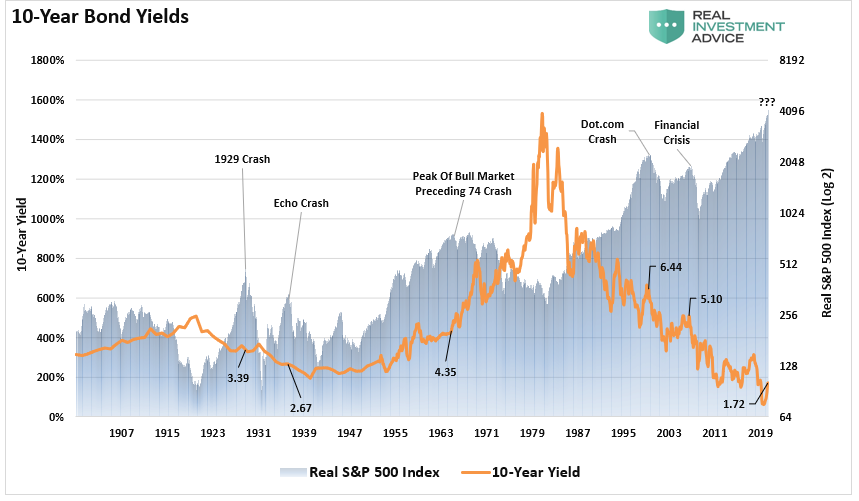
The chart below is the “real” S&P index versus the 10-year Treasury bond. What you will notice is that there is not a high degree of correlation between rates and markets.
Some Analysis
Looking at the chart above, we find:
- Exceptionally high interest rates, which have occurred twice, coincided with low stock market valuations. This fact does not prove that high interest rates “cause” low stock valuations. But at least the historical record is consistent with such a statement.
- Exceptionally low interest rates, which have occurred twice, have coincided with high stock market valuations only once; today. The historical record (1/2 probability) does not validate the highly-confident mainstream narrative that low-interest rates “cause” or “justify” high stock market valuations.
- Extremely high stock valuations have occurred three times. Only once (1/3 probability) did high stock valuations coincide with low-interest rates; today.
- If extremely low-interest rates do not cause extremely high stock market valuations, then a rise in rates should not necessarily cause a decline in stocks. That is, the historical record does not support the near-certain mainstream narrative that an increase in rates will torpedo stock prices.
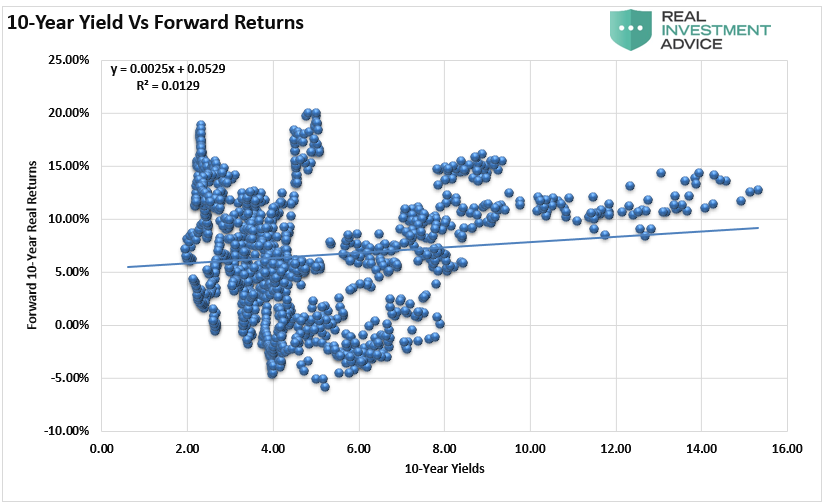
Furthermore, if we run a correlation between 10-year yields and forward returns, as suspected, we find almost no correlation to support the claim.
Earnings Yield & Forward Returns
As noted, if we are going to talk about low yields, we also need to discuss “earnings yield,” which is simply the inverse of the “price to earnings” ratio.
Historically, when interest rates or inflation are low, the stock market’s E/P is also. When isolating periods where interest rates were low, such occurred only twice; in the 1940s and currently. In the 1940s, stock valuations were low, along with interest rates. Therefore, the statement that low-interest rates cause high valuations is a .500 batting average, equivalent to a coin-flip.
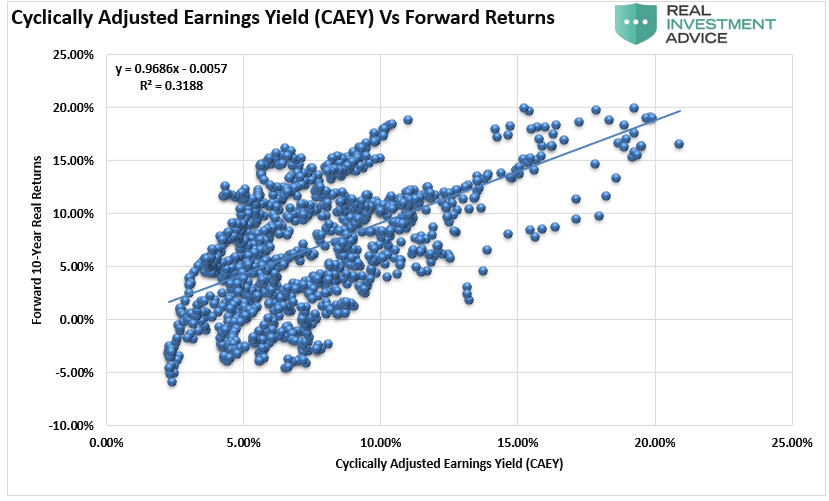
However, if we look at periods of exceptionally low earnings yields compared to the market, we find a better correlation to corrections and outright bear markets.
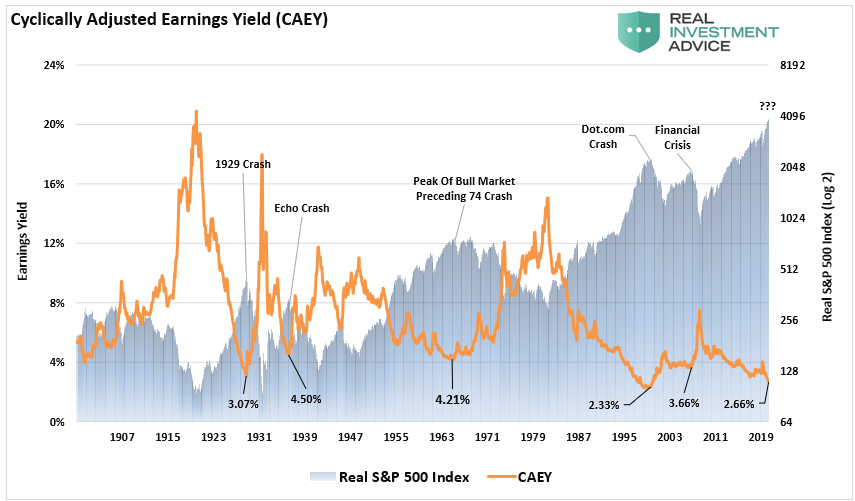
As shown, there is a reasonable correlation between low earnings yields and low forward returns. Historically speaking, with an earnings yield of 2.66%, forward returns over the next decade should somewhere between +2 and -5%.
But what about the excess yield?
Excess CAPE Yield & Forward Returns
We previously discussed Dr. Robert Shiller’s attempt to justify high valuations. To wit:
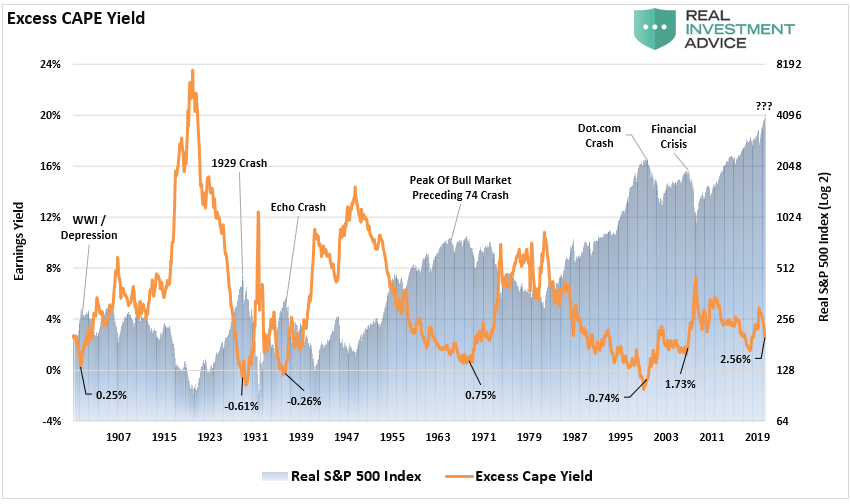
“There has been much puzzlement that the world’s stock markets haven’t collapsed in the face of the COVID-19 pandemic. Especially in the United States, which has recently been setting record highs for new cases. But maybe it isn’t such a puzzle. A measure we call the Excess CAPE Yield (ECY) puts the long-term outlook for the world’s stock markets in better perspective.”
Essentially, the “Excess Cape Yield” is the difference between the “Earnings Yield” less the “10-Year Interest Rate.” Shiller’s calculation is shown below and compared to the “real” S&P 500 index.
A cursory glance of “low” excess CAPE yields, compared to the index, suggests an alignment with historical market peaks rather than advancing “bull markets.”
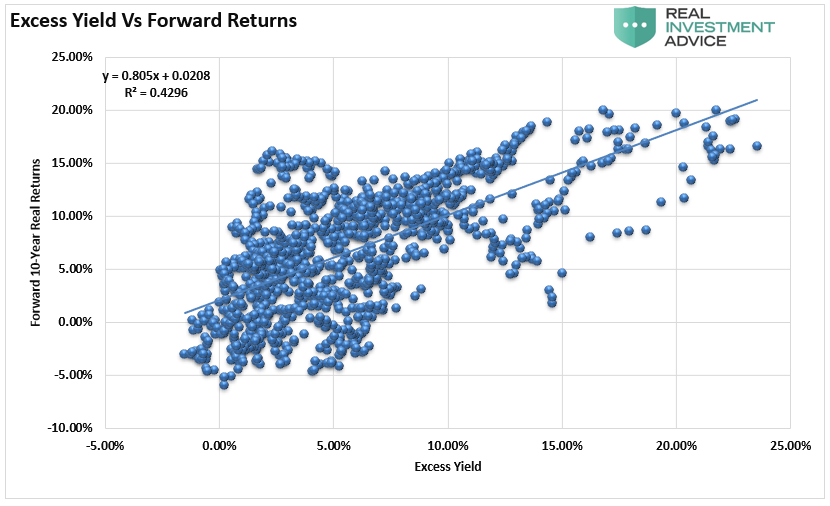
Again, running a correlation of the “excess yield” to forward 10-year returns, we find an even higher correlation between low excess yields and low returns. If we use Shiller’s excess yield of 2.56%, such would suggest that returns from equities over the next decade will likely average between -5% to +5%.
Does that mean that every year will be a low return year?
No.
It does suggest that there will be a nasty bear market somewhere along the way.
Conclusion
It is imperative to remember valuations are very predictive of long-term returns from the investment process. However, they are horrible timing indicators.
Beware the investment advisor, pundit, or superstar investor who is sure that extremely low rates cause incredibly high stock valuations.
There is much to debate about the current level of interest rates and future stock market returns. However, what is clear is the 40-year decline in rates did not mitigate two extremely nasty bear markets since 1998, just as falling rates did not mitigate the crash in 1929 and the subsequent depression.
As Clifford Asness concluded:
So, when pundits say it is a good time for long-term investors to buy stocks because interest rates are low, and then show you something like chart above to prove their point, please watch the tense of what they say, as what they often really mean is that it WAS a good time to buy stocks ten years ago, as investors are now paying a very high P/E for the stock market (perhaps fooled into doing so by low interest rates as I contend), and the story going forward may be painfully different.”
Do low rates justify high valuations?
History suggests they don’t.
The post Technically Speaking: Forward Returns Continue To Fall appeared first on RIA.