Just recently, there have been numerous “bullishly biased” analysts and bloggers discussing the turn up in the monthly MACD indicators as a “sure sign” the bull market rally is set to continue.
While “bullish buy signals” on any long-term indicator is indeed a positive sign, there are a few “warning labels” which must also be considered. For example:
- Since these are monthly indicators, the signal is only valid at the end of the month. Mid-month signals can be reversed by sharp price movements.
- No one signal provides any “certainty” about future market outcomes.
- Time frames of signals matter. Given monthly signals are long-term in nature, the signal time frames are important in providing actionable information.
So, is the bull market back?
That’s the answer we all want to know.
Each week on RIA PRO we provide an update on all of the major markets for trading purposes. You can view an unlocked version here. (We also do the same analysis for each S&P 500 sector, selected portfolio holdings, and commodities. You can try RIA PRO FREE for 30-days)

But as longer-term investors and portfolio managers, we are more interested in the overall trend of the market. While it is fundamental analysis derives “what” we buy, it is the long-term “price” analysis which determines the “when” of the buying and selling aspects of portfolio management over the long-term.
For us, the best measures of the TREND of the market is through longer-term weekly and monthly data. Importantly, as noted above, these longer-term data signals are only valid at the end of the period. It is not uncommon for signals to be triggered and reversed during the middle of the period, which creates “false”signals, and poor outcomes. Since we are more interested in discerning changes to the overall “trend” of the market, we find monthly indicators, which are slow-moving, tend to reveal this more clearly.
In April of 2018, I penned an article entitled “10-Reasons The Bull Market Ended,” in which we discussed the yield curve, slowing economic growth, valuations, volatility, and sentiment. Of course, 2018 turned out to be a tough year culminating in a 20% slide into the end of the year. Since then, we have daily reminders we are “close to a trade deal,” and the Fed has completely reversed course on hiking rates and extracting liquidity. In July, we published S&P 3300, The Bull Vs. Bear Case.
While volatility and sentiment have reverted back to levels of more extreme complacency, the fundamental and economic backdrop has deteriorated further.
The first chart shows the monthly buy/sell signals stretched back to 1995 (25 Years). As shown, these monthly “buy” and “sell” indications are fairly rare over that stretch. What is interesting, is that since 2015 there have been two-major sell signals, both of which were arrested by Central Bank interventions.
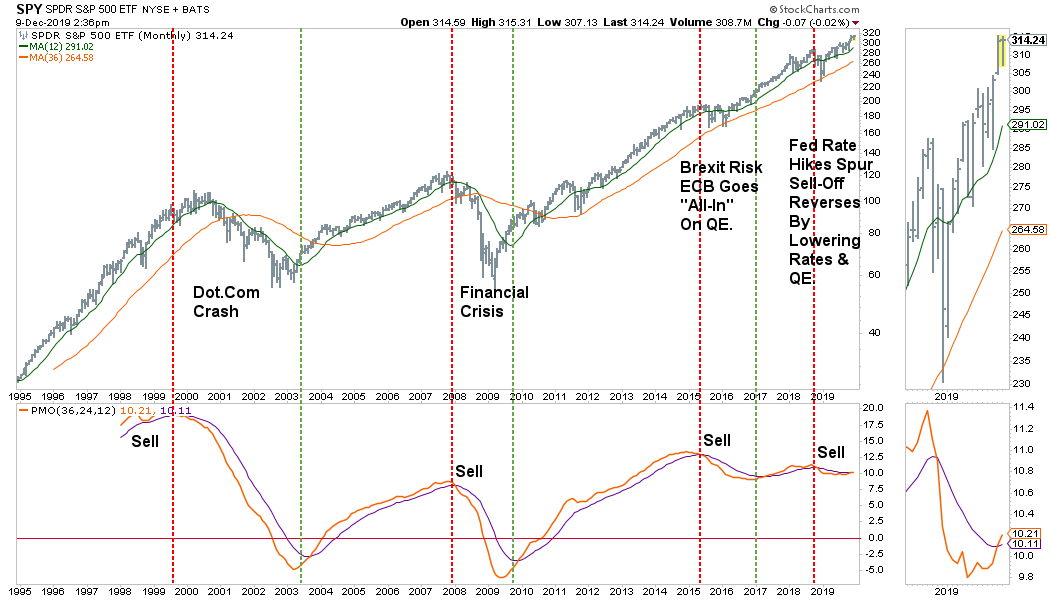
Importantly, while Central Bank interventions have been able to halt declines, the trade-off has been a negative divergence in overall momentum. This negative divergence in momentum suggests that the current monthly “buy signal,” if it is able to hold through the end of December, could quickly reverse if the Fed ceases, or reduces, its current monetary interventions.
With global economic growth continuing to drag, an unresolved “trade war,””Brexit,” and weaker earnings growth, the question is whether Central Banks can accommodate the markets long-enough for all of these more negative issues to be resolved?

Given that we are 10-years into a “cyclical” bull market, and have yet to complete the second half of the “full-market” cycle, there is risk to the bullish view.
I know…I know…
“But this time is different because of ‘_(fill in the blank__’”
Maybe, I certainly won’t argue the point of Central Bankers manipulating markets currently.
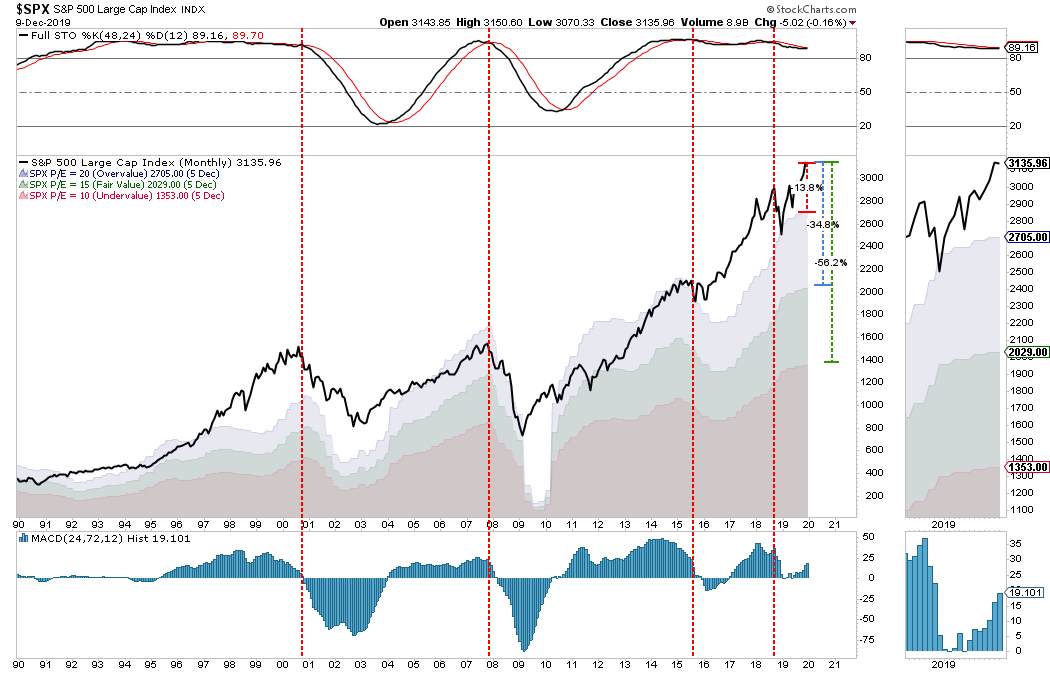
However, we can take those same monthly momentum indicator above back to 1950, and add two confirming monthly indicators as well. The vertical “red dashed lines” are when all three indicators have aligned which reduces false signals.
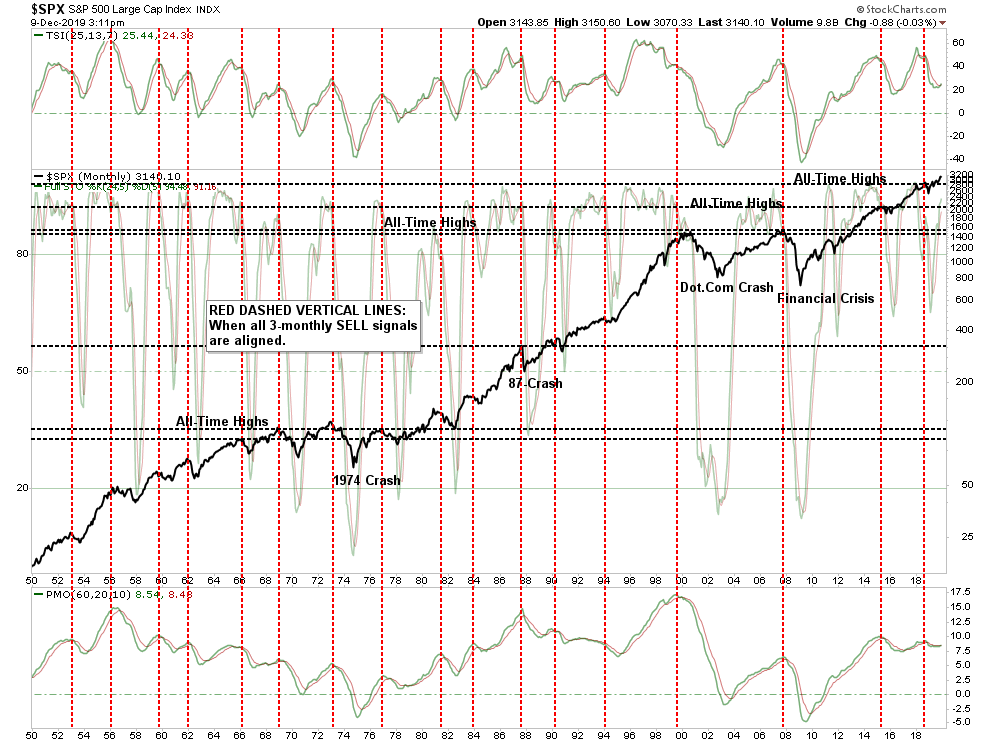
I can’t believe I have to write the next sentence, but if I don’t, I invariably get an email saying “but if you sold out, you missed the whole rally.”
What should be obvious is that while the monthly “sell” signals have gotten you out to avoid more substantial destruction of capital, the reversal of those signals were signs to “get back in.”
Investing, long-term, is about both deployment of capital and the preservation of it.
Currently, the monthly indicators have all aligned to “confirm” a “buy signal,” which since 1950 has been a good indication of rising markets. Yes, the bull market is back! However, when these signals have existed in a “negative tren,d,” and are diverging from the market, corrections have often followed. While the most current buy signal could indeed last for 6-months to one-year, which would conform to our cyclical indications, there are several things to consider:
- As was seen in the 1960s and 70s, “buy signals” in the negative trend led to repeated rallies and corrections until the cycle was completed at the bottom of the 1974 bear market.
- A rising trend in the “buy signals” was more aligned with a longer-term “secular” bull market cycle which consisted of very short-term sell signals.
- With markets very overbought on a longer-term basis, price advances could be somewhat limited.
Yes, the recent “buy” signal could turn out to be a “1995” scenario where the market rallied almost non-stop into the “Dot.com” crash, but the fundamental and technical backdrop doesn’t really support that thesis.
Furthermore, the QUARTERLY chart remain concerning given the massive extension above the long-term trend and continued overbought conditions. Historically, reversions from such extensions above the long-term trend line have not been kind to investors.
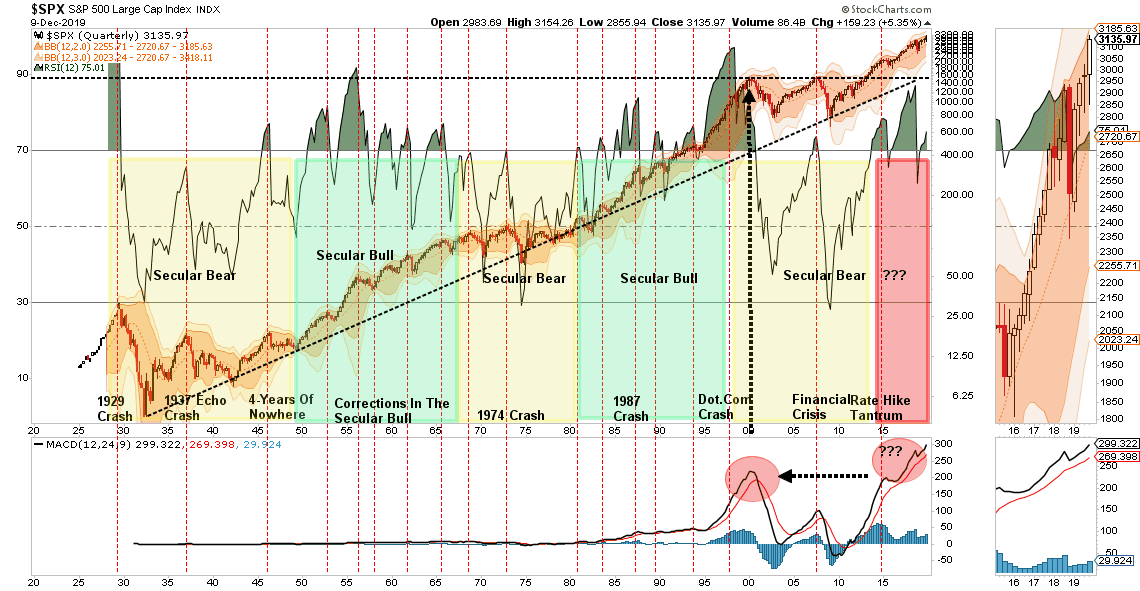
Let me be VERY clear. Both the MONTHLY and QUARTERLY signals confirm the “bull market” that began in 2009 remains intact currently. This is why we are maintaining our long-biased exposure in portfolios. However, the current market cycle is extremely extended and is approaching a reversion within the next 12-24 months. That reversion will likely extract most of the gains of the previous bull market. As noted this past weekend, such an occurrence would be part of a normal full-market cycle.
One of the biggest reasons not to equate the current monthly “buy” signal to a “1995” type period is valuations. In 1987, valuations were low and rising at a time where interest rates and inflation were high and falling. Today, that economic and valuation backdrop are entirely reversed.
Currently, a correction from current price levels of the market to PE20 (20x current earnings) would be a 13.8% decline. However, a drop back to the long-term average of PE15 would entail a 34.8% fall, with a full-reversion to PE10, which would be required to “reset” the market, would wipe our 56.2% of the total market value.
Emotionally, the hardest thing for investors to do is to sit on their hands and avoid “risk” when the markets are rising. But this is the psychological issue which plagues all investors over time which is to “buy high”and “sell low.”
It happens to everyone.
David Rosenberg previously summed up investor sentiment very well.
“Well, the bulls certainly are emboldened, there isn’t any doubt about that. And this confidence, bordering on hubris, is proving very difficult to break. We are back to good news being good news, and bad news is also treated as good news.”
That is indeed the situation currently. “Bad news” means more Central Bank intervention, and “good news” is, well, just good news and is taken at face value with few questions. Don’t forget that “all good things do eventually end,” and being able to identify, and act, when the change comes is what separates winners from losers.
What This Means And Doesn’t Mean
At a poker table, if you have a “so so” hand, you bet less, or fold. It doesn’t mean you get up and leave the table altogether.
What this analysis DOES MEAN is we use this rally to take some actions to rebalance portfolios to align with some the “concerns” discussed above.
- Trim Winning Positions back to their original portfolio weightings. (ie. Take profits)
- Sell Those Positions That Aren’t Working. If they don’t rally with the market during a bounce, they are going to decline more when the market sells off again.
- Move Trailing Stop Losses Up to new levels.
- Review Your Portfolio Allocation Relative To Your Risk Tolerance. If you are aggressively weighted in equities at this point of the market cycle, you may want to try and recall how you felt during 2008. Raise cash levels and increase fixed income accordingly to reduce relative market exposure.
Here is the question you need to answer for yourself. What’s worse:
- Missing out temporarily on the initial stages of a longer-term advance, or;
- Spending time getting back to even, which is not the same as making money?
Currently, the monthly and quarterly indicators are indeed bullish. However, it is important to remember that it takes some time for these indicators to reverse, and issue clear signals to extract cash from the market. Currently, the risk of disappointment greatly outweighs the potential for upside surprises at this juncture.
What happens next may just surprise everyone.