via upfina:
When the Fed starts hiking rates, it’s the beginning of the end of the business cycle. That being said, there are long hike cycles like the current one. There hasn’t been a recession since the Fed started hiking rates in December 2015 partially because the Fed has been hiking rates gingerly. Whenever the markets have feared a recession this cycle, the Fed has calmed them whether it’s through rate hike pauses like now or dovish language which we might see more of at the June 19th Fed meeting.
With such a long expansion, some investors have thrown out their playbook for timing the next recession. Some even believe the Fed has outlawed the business cycle by responding to every worry the market has. While the Fed has learned from prior cycles, it hasn’t ended the business cycle because there are always new circumstances. If the Fed could perfectly control the economy, we’d see higher annual growth than we have this cycle. Growth per year has been slow, which is why the total growth in this expansion isn’t at a record even though this expansion is nearly the longest since the 1800s.
https://twitter.com/cullenroche/status/1130914156436049920
Recession Countdown
The list below shows the typical playbook for markets and the economy when the Fed hikes rates. This list aims to simplify the cycle.
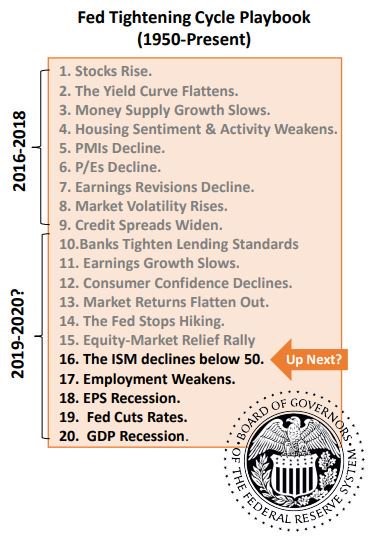
While it’s valuable, let’s review its potential flaws. First, let’s look at number 4. Housing sentiment weakened last year, but it’s starting to rebound this year. New home sales hit a new record high in March which was the first cycle high since November 2017. The more interest rates fall, the stronger the housing market will get (all else being equal). The housing market’s recession signal might be reversed. Number 7 refers to declining earnings revisions. While they have been weak in May, there was an earnings recession from 2014-2016 which didn’t lead to an economic recession.
Number 15 is perfect because we’ve seen an equity market relief rally even though the economy hasn’t exited its slowdown. Regardless of where stocks go, this will be a relief rally until the slowdown ends. We don’t usually focus on technical analysis on this website, meaning particular levels won’t stop this from being a relief rally. Number 16 is the PMI falling below 50. The May Markit flash PMI reading came close to falling below 50 as it was 50.9. It has only barely and briefly fallen below 50 a couple times this cycle.
Consumer Confidence
Number 12 shows consumer confidence peaked. Technically, the University of Michigan preliminary consumer confidence index reached a 15 year high in May. It was helped by the 15 year high in the expectations index. The Cornerstone Macro consumer confidence reading is shown in the chart below. It peaked in October 2018.
The other important point about this chart is it shows a big downturn in mid-May and then a quick reversal. This matters because we assessed the preliminary University of Michigan index would have been lower if it only included data from after the latest round of tariffs were announced. We knew the sentiment reading would drop, but we didn’t know how much it would fall. As you can see, there is a 6.5% gap from the recent peak to the May 17th reading. This is similar to the drop late last year. However, now in the week of May 24th, it reversed, potentially signaling the tariff announcements didn’t have a sustainable negative impact on the consumer.
Nancy lowered her 2Q US GDP forecast to 2% (from 3%), with downside risk, on the back of a weaker consumer. She’s closely watching business and consumer confidence, which have been hit from trade uncertainty and tighter financial conditions. #economics #consumer #tradewar pic.twitter.com/31FK8WtDdC
— Cornerstone Macro (@csm_research) May 28, 2019