by UPFINA
The economy is exhibiting a bit more flexibility than we ever thought was possible. We aren’t sugar coating the terrible cost of this recession, but we have noticed some changes that are softening the blow. We’ve seen banks forbearing mortgage payments. We’ve seen credit card companies let customers delay payments if they were impacted by COVID-19. We’ve also seen covenants loosened to avoid bankruptcy. Firms have covenants on their debt ratios (debt to EBITA etc.). Some have received exemptions from those covenants because it makes more sense to have a company that is usually free cash flow positive stay afloat because when the economy reopens, it will be able to pay the money back and potentially refinance.
We’ve also seen some management teams take a temporary pay cut. Finally, we’ve seen companies and businesses being allowed to not pay rent. A lot of this is made possible by the Fed backstopping the system. This can easily turn into a banking crisis if no one can pay their bills. The support from the federal government isn’t perfect, but this has been the largest peace time spending spike on record. The key point we’re making is the worst case scenario hasn’t happened for the economy because many have allowed for flexibility. The bad apples are the exception, not the rule.
Another Prediction From Fundstrat
We previously showed a prediction from Fundstrat which showed how the recovery in the economy and the stock market might play out. It’s always interesting to review a contrarian viewpoint. They are back at it with another one which is shown in the chart below.
FUNDSTRAT: Three waves of bad news coming:
1. COVID-19 peak
2. 1st wave of the economic shutdown
3. The hit taken by "asset owners": business owners, landlords, banks, etc
Stocks bottoming now “suggests the stock market is looking past this September 2020 period.” @fundstrat pic.twitter.com/pRdsGJK4we
— Carl Quintanilla (@carlquintanilla) April 15, 2020
Based on this chart, they believe COVID-19 has peaked and social distancing is at its peak. The latter is supported by some of the European economies partially reopening. For example, some businesses in Spain and Italy have reopened. Plus, school for young children has reopened in Denmark. The third wave in this chart shows the banks, suppliers, landlords, and business owners will be hit the hardest in Q2 and Q3.
As you can see, the firm calls a move lower in stocks until about September the logical and rational option. However, it is going with the less rational, non-consensus play to be bullish. The bearish argument on the economy can be right, while being wrong for stocks. This is why many people think the stock market is broken or macroeconomic investing doesn’t matter. Macro investing works because it tells you to buy stocks when the labor market is weak. When the unemployment rate is above 6%, the average gain per year is 13.7%. When jobless claims are above 415,000 and falling, the average gain per year is 17.6%.
Jobless Claims Spike
In the week of April 4th, jobless claims were revised up from 6.606 million to 6.615 million which still puts it just below the record set the previous week. This increases the likelihood that, that was the cycle peak. There is only a certain number of people who can file for claims before literally every one has. Essentially, that was the most possible people who could file in one week.
22.034 million people have filed for unemployment claims in this recession. If the vast majority of them were production and non-supervisory workers, that’s a loss of 21% of those jobs in 4 weeks. The job losses are record breaking. At the peak of initial claims in March, there were more initial claims in one week, than the peak of continuing claims at the end of the last recession. Continuing claims are all the people who are getting benefits. Initial claims is just the people who filed to get them that week. Since continuing claims peak near the end of the recession, we’ll be watching that data point in the next few months.
In the week of April 11th, there were 5.245 million initial jobless claims which was below estimates for 6 million. This is a double positive because it means claims are falling and economists are finally too pessimistic. To be clear, in the near term this is the worst possible situation for the labor market.
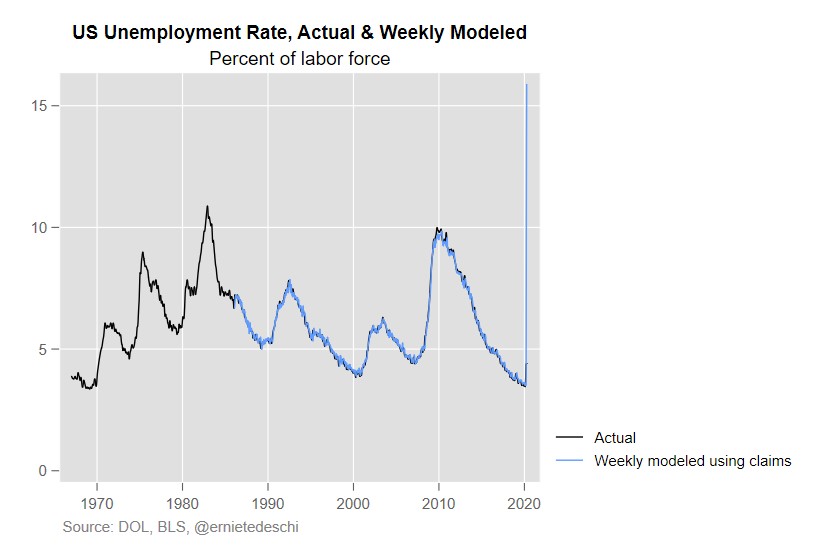
As you can see from the chart above, a model implies the current unemployment rate is 16%. Another model shows that the poverty rate will be in the mid to high teens with that unemployment rate which is above the peak after the financial crisis. Google trends data has done very well at predicting jobless claims. It implies claims will continue to fall.
No One Knows Anything
This is by far the most uncertain peacetime macroeconomic environment in history. The chart below shows the GDP forecast dispersion since 1968. As you can tell, the dispersion is about 4 times as wide it was at the peak of the last recession. Economic forecasts have fully transformed into predictions about the virus and fiscal/monetary policy.
Going to tweet out some of damn fine charts from Bank of America. First up, the economic outlook has never been this uncertain before. By a big margin. pic.twitter.com/WHW6jZN8Ev
— Robin Wigglesworth (@RobinWigg) April 14, 2020
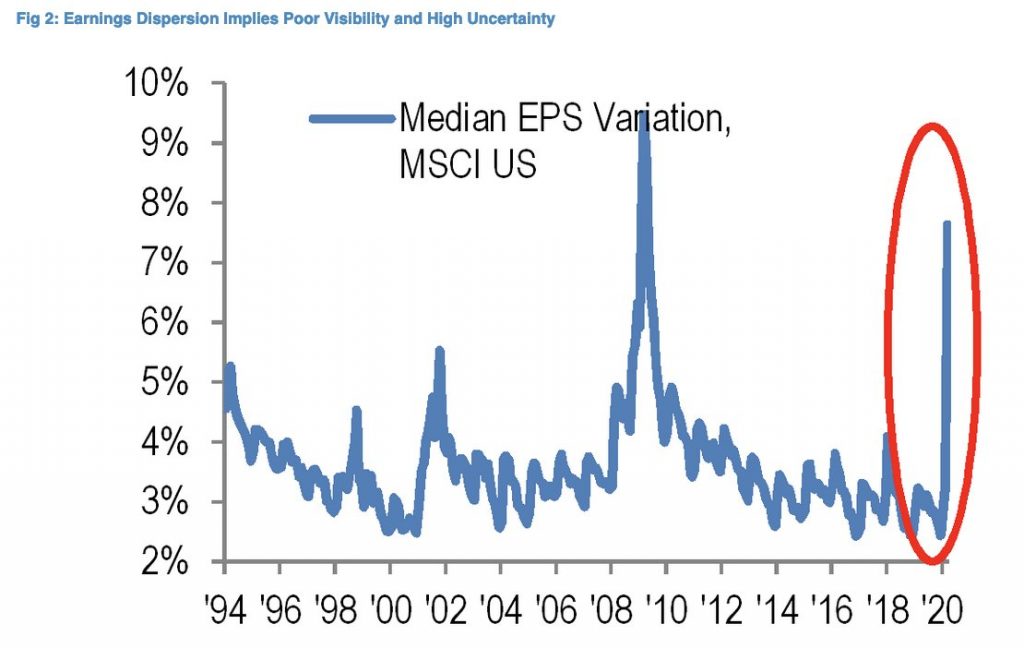
It’s not just GDP that experts are unsure of. They also are unsure of earnings. As you can see from the chart below, the median MSCI EPS variation is near the peak in the last recession. It’s possible that some estimates have been updated quicker than others, leading to a vast dispersion. It’s either that or firms are using different facts to make estimates. According to JP Morgan, 2020 S&P 500 EPS estimates range from $50 to $150. With such uncertainty, people are moving their attention to 2021 earnings. As of April 17th, the Q2 EPS growth estimate was -23.88% according to The Earnings Scout. The lower estimates go, the easier they are to beat. As earnings season ramps up next week, we will see estimates accelerate their descent. Estimates fall the most during earnings season.
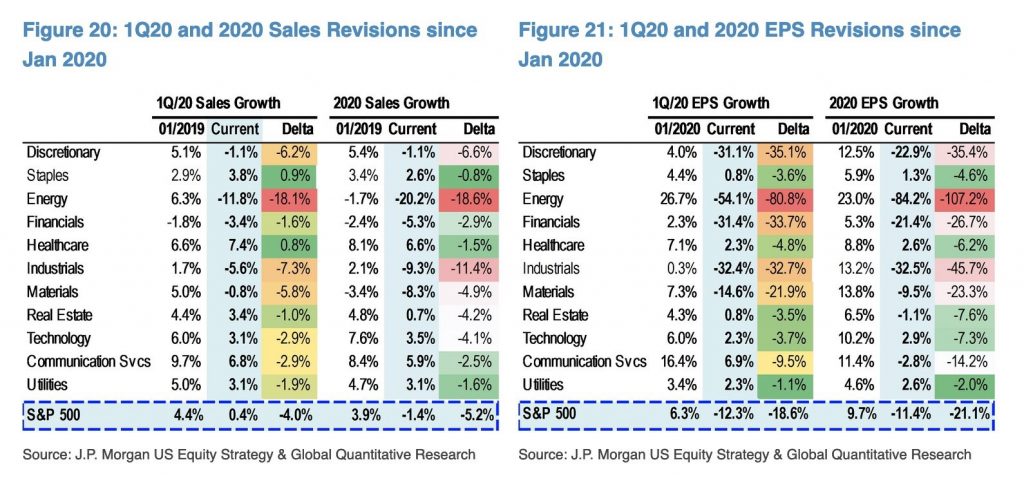
The tables below show the changes to Q1 and Q2 sales and EPS growth estimates by sector. Energy had a 11.4% hit to sales estimates and a 107.2% hit to EPS estimates. It’s no surprise that occurred because oil prices declined. It’s also no surprise staples had the smallest decline in sales estimates and utilities had the smallest decline in EPS estimates. Many staples companies like Costco, Wal-Mart, and P&G are doing better in this environment since people can’t go out to eat.
Conclusion
The media likes to focus on what is going wrong. That’s not necessarily a bad thing because giving light to people who are hurting can potentially inspire change. We’re just saying as neutral observers that there has been more flexibility than you’d expect in a recession. Fundstrat thinks stocks have bottomed. Stocks usually do very well when the labor market is in bad shape. The unemployment rate is likely in the mid-double digits. There is extreme uncertainty shown in the dispersion of GDP and EPS estimates. Energy was hurt the most by this decline; staples and utilities were hurt the least.