via Colby Smith
Just days after US stocks entered their longest-ever bull market (although the FT’s John Authers calls bull**** on this), the S&P 500 and Nasdaq closed at record highs. While many have cheered on these milestones and say there’s still room to run, others have greeted them with far less fanfare on fears that it’s all downhill from here.
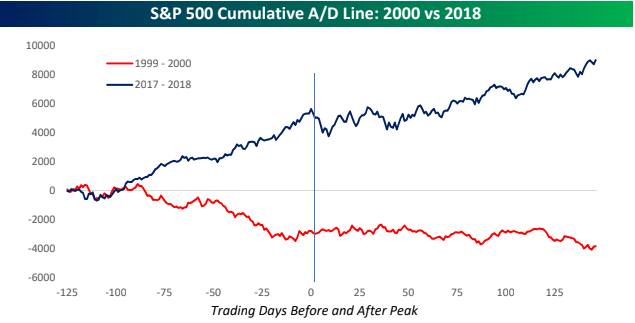
To make the case that the current bull market is not yet out of steam, many investors point to the cumulative advance/decline (A/D) line for the S&P 500. This indicator measures the number of stocks rising or falling on a daily basis. If it trends negative, that means more stocks are declining than rising. The reverse is true if it’s positive. Bespoke Investment Group believes the cumulative A/D line can say a lot about how much momentum the market has left. Here’s what they wrote in a recent note:
In a rising market, breadth, as measured by the cumulative A/D line, should be rising as well. If it’s not, it serves as a red flag that leadership in the rally is thin. We’ve all heard the phrase ‘there’s strength in numbers,’ and it’s also applicable to the market. In a broad-based rally, you can afford to have a few stocks falter because other stocks are there to pick up the load. In a narrow rally, though, if you lose a few stocks, you won’t have much left.
The cumulative A/D line of the S&P 500 six months before and after a peak in late-January is not only positive, but has topped new highs. That’s in contrast to in 1999-2000, before the dot-com bubble burst, when the cumulative A/D line had turned negative. Back then, Bespoke says, “it was tech and only tech”, whereas this time around it’s “tech and a lot of other companies.” Here’s their chart comparing the two rallies:
While Morgan Stanley’s Michael Wilson concedes that the cumulative A/D line is ticking higher, he stresses that other indicators of market breadth are saying something quite different. The percentage of stocks making new highs and the percentage of stocks above their 200-day moving averages have fallen. More worryingly, the S&P 500’s narrowness has become “extreme” in its most recent leg higher.
According to Wilson, the S&P 500 would not be busting through its recent record highs without Amazon, Microsoft and Apple. Here’s his chart tracking the normalised performance of the S&P 500 versus a version excluding the three stocks:
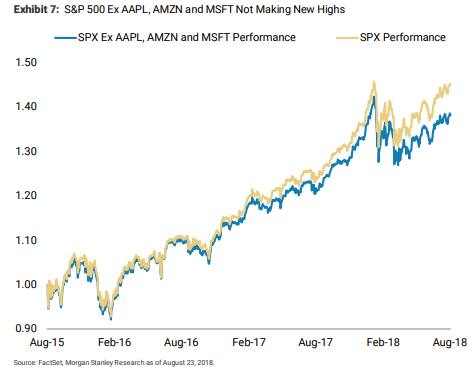
A glance at the FAAMG stocks (Facebook, Apple, Amazon, Microsoft and Google) confirms this. Their combined market capitalisation of $4.1trn is just about equal to the combined market capitalisation of the 283 smallest S&P 500 members, according to Bank of America Merrill Lynch. So long as investors piled into the FAAMGs and other technology stocks, market-watchers could sideline the risks brought on by this dominance. Not anymore. Inflows to the sector more broadly have slowed in recent months:
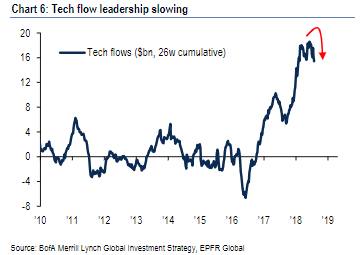
How long the bull market can sustain itself on such a small and shrinking base remains to be seen. Morgan Stanley predicts growth to slow later this year and next. In their eyes, “this is a more dangerous set up than most recognise”.
****
we're going to have to see non-stop hope/hype PR propaganda from WH to continue this parabolic trend $SPX — otherwise, it'll fade quick & hard. pic.twitter.com/2dhtuJNuHg
— Alastair (@StockBoardAsset) August 28, 2018