by econimica
INDIVIDUAL NATIONS
JAPAN
- 127 million or 1.6% global population
- 3.4% global energy consumption
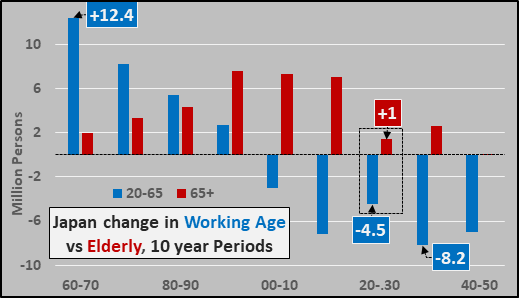
- 2020-2030…Working age population decline of 6.5% (-4.5 million)
Patient zero in the epidemic of population collapse, Japan’s negative fertility rates coupled with little to no immigration has Japan leading the race to the bottom. Only Japan’s exports were able to offset the collapsing domestic demand. Below, working age Japanese population versus the growth of the elderly population. Japan is entering it’s third decade of working age population decline, declining slightly slower than the previous decade before the bottom really falls out from 2030 through 2050.
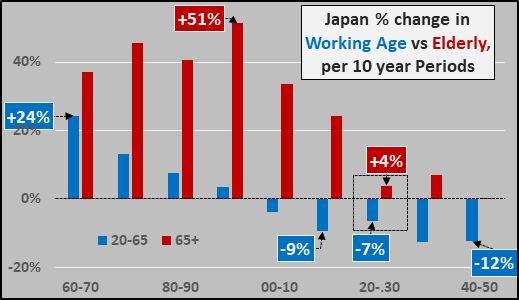
Percentage change, per 10 years, of working age population versus elderly population. Over the next decade, Japan’s working age population will decline by 7% while its 65+ elderly population will increase by just 4%. Within 20 years, Japan’s elderly population will cease growing and Japan’s population will be in decline at all levels. But tellingly, Tokyo’s population (representing about 30% of Japan’s total population) is still rising meaning the working age population decline across the remainder of Japan’s rural locations is of epic proportions. This collapse of working age across rural locations, as young head to urban centers in search of opportunity, is being mirrored across the rest of the world and is the final act of the economic decline worldwide.
GERMANY
- 84 million or 1.1% global population
- 2.1% global energy consumption
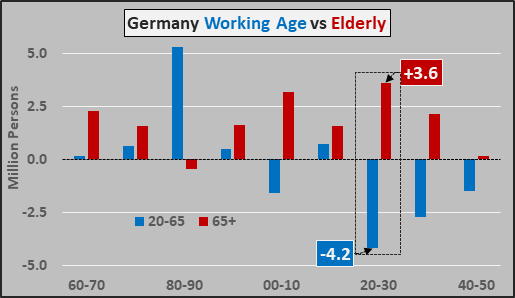
- 2020-2030…Working age population decline of 8% (-4.2 million)
Just behind Japan in long term negative fertility but far more open to immigration, the working age German population versus the growth of the elderly population. Germany’s creation of the Euro area was its means to avoid collapsing domestic demand for its exports by quintupling the market for its exports absent a strong Deutschmark. Of course, Germany’s economic salvation has meant abject economic destruction for most of the Euro nations.
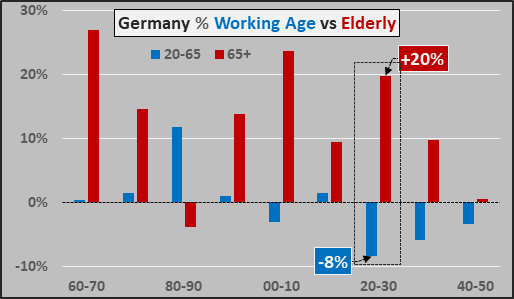
Percentage change, per 10 years, of working age versus elderly.
SOUTH KOREA
- 51 million or 0.7% global population
- 2.2% global energy consumption
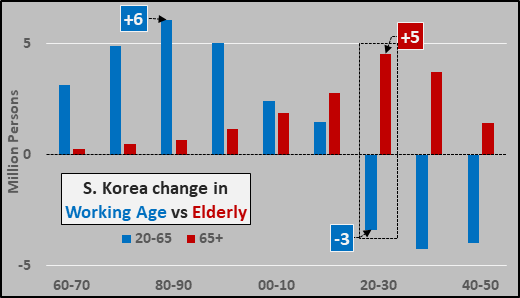
- 2020-2030…Working age population decline of -10% (-3 million)
The new poster child for population collapse is South Korea. Just like Japan and Germany, an incredibly urbanized and industrialized export powerhouse. Working age South Korea population change, per decade, versus the growth of the elderly population (below).
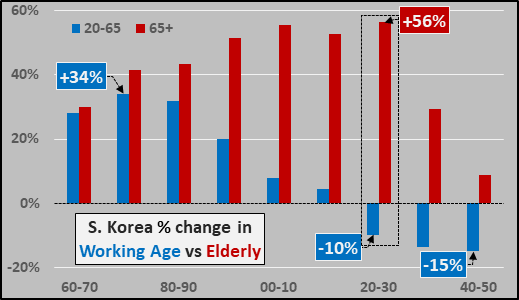
Korea’s reliance on global exports is likely unmatched as their domestic population is now and will continue to collapse indefinitely. Below, the percentage change, per 10 years, of working age versus elderly is truly astounding.
CHINA
- 1.43 billion or18.6% of global population
- 24.3% global energy consumption
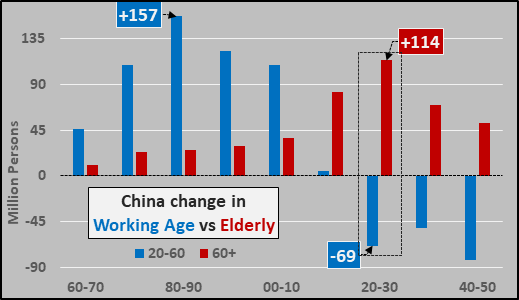
- 2020-2030…Working age population decline of -8% (-69 million)
China is the elephant in the room with a collapsing working age population versus the gargantuan growth of its elderly population (below). This chart is 20 to 60 year-olds and elderly 60+ year-olds, as China has compulsory retirement at age 60 for males, 55 for females.
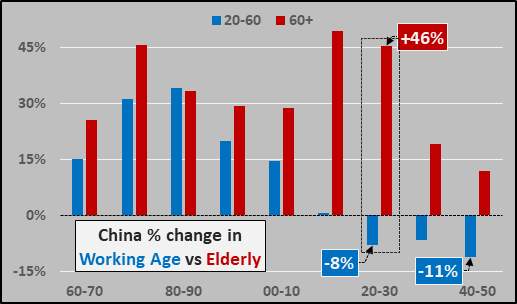
Percentage change, per 10 years, of working age versus elderly.
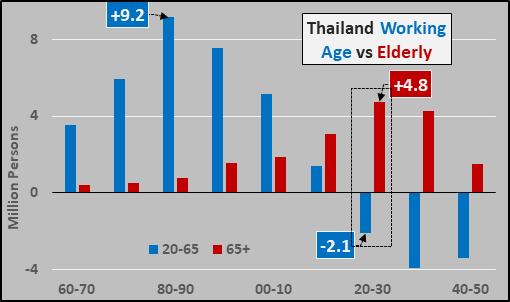
THAILAND
- 70 million or 1% of global population
- 1% of global energy consumption
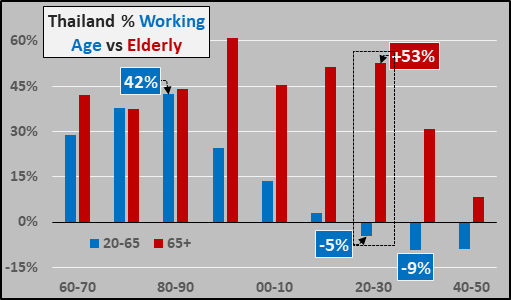
- 2020-2030…Working age population decline of -5% (-2.1 million)
Working age Thai population change, per ten years, versus the growth of the elderly population (below).
Percentage change, per 10 years, of working age versus elderly (below).
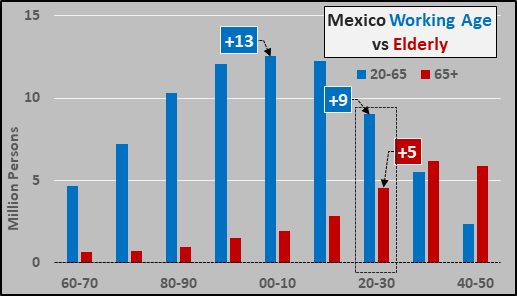
MEXICO
- 128 million or 1.7% of global population
- 1.4% global energy demand
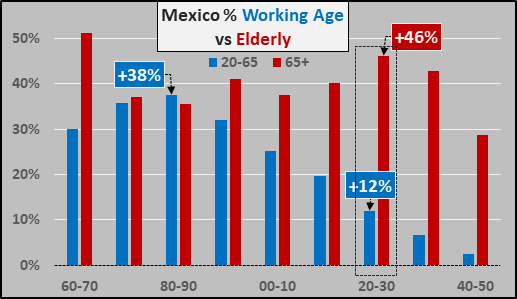
- 2020-2030…Working age population of +12% (+9 million) but down from decade long peak of +38% (+13 million). Growth remains through 2050 but only continuing to decelerate.
Working age Mexican population change per decade versus the growth of the elderly population (below).
Percentage change, per 10 years, of working age versus elderly.
IRAN
- 83 million 1.1% global population
- 1.7% energy consumption
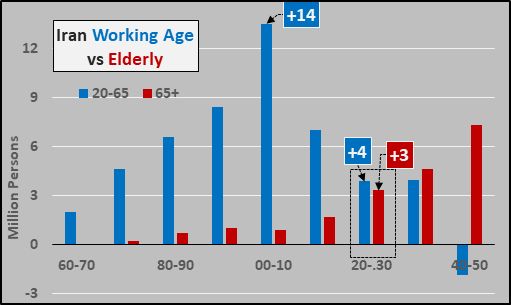
- 2020-2030…Working age population growth of +7% (+4 million)…working age growth is decelerating and will turn to depopulation prior to 2040.
Working age Iranian population change, per ten years, versus the growth of the elderly population (below).
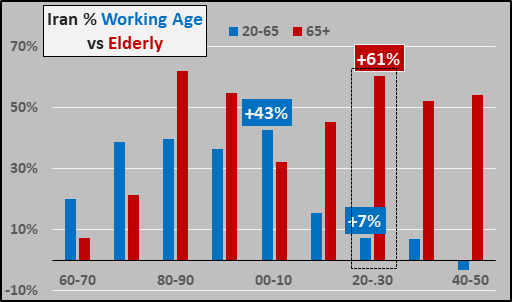
Percentage change, per 10 years, of working age versus elderly (below).
BRAZIL
- 211 million or 2.7% global population
- 2.2% global energy consumption
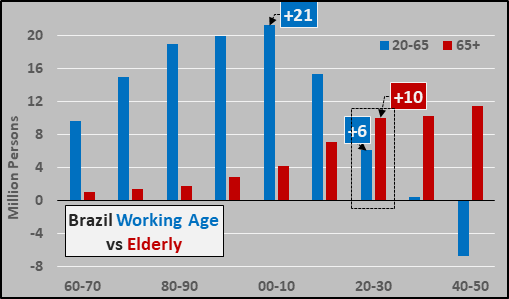
- 2020-2030…Working age population increase of +5% (+6 million) and this is essentially the last decade of working age growth in Brazil.
Working age Brazilian population change, per ten years, versus the growth of the elderly population (below).
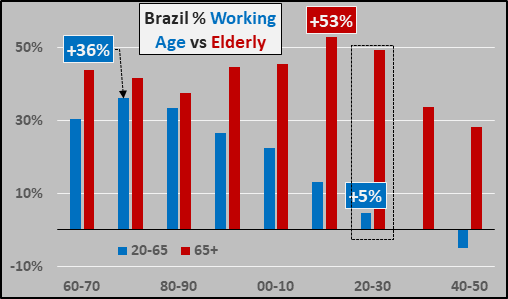
Percentage change, per 10 years, of working age versus elderly (below).
INDIA
- 1.37 billion or 17.7% global population
- 5% global energy consumption
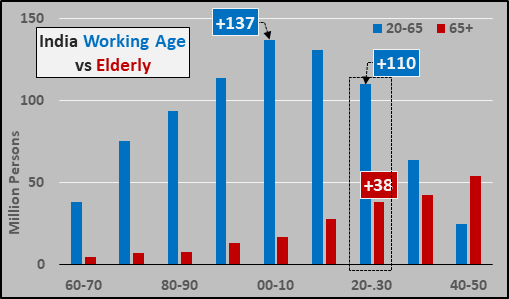
- 2020-2030…Working age population growth of +14% (+110 million), decelerating from +30% and +137 million in earlier decades. Working age growth continues decelerating through 2050.
Working age Indian population change, per ten years, versus the growth of the elderly population (below).
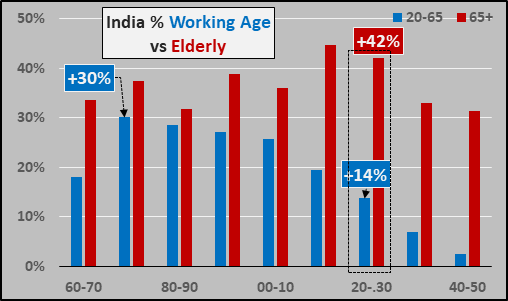
Percentage change, per 10 years, of working age versus elderly (below).
REGIONS
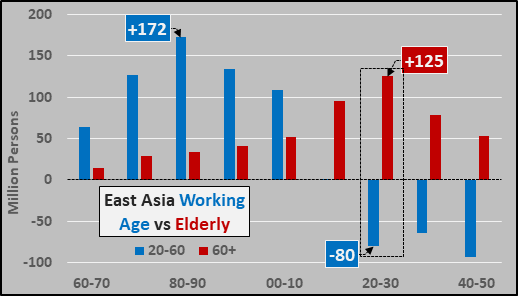
East Asia (China, S/N Korea, Japan, Taiwan, Mongolia)
- 1.67 billion or 22% of global population
- 31% of total global energy consumption
- 2020-2030…Working age depopulation of -8% (-80 million)
Working age (20 to 60 year-olds) East Asia population change, per ten years, versus the growth of the elderly population (60+ year-olds, below).
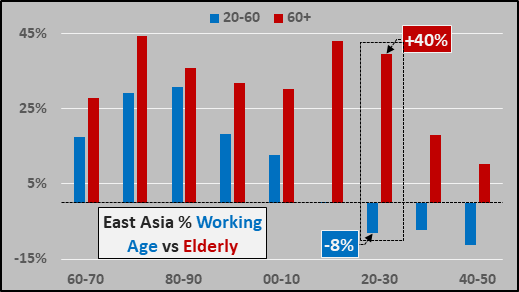
Percentage change, per 10 years, working age versus elderly (below).
WESTERN EUROPE
- 455 million or 5.9% of global population
- 12.5% total global energy consumption
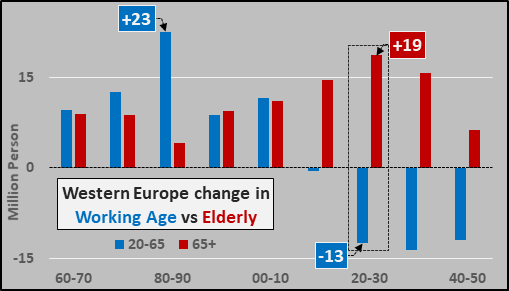
- 2020-2030…Working Age depopulation of -5% (-13 million)
Working age Western European population change, per ten years, versus the growth of the elderly population (below).
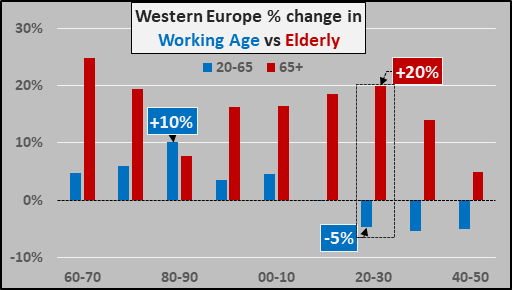
Percentage change, per 10 years, of working age versus elderly (below).
EASTERN EUROPE
- 295 million or 3.8% of global population
- 7.5% total global energy consumption
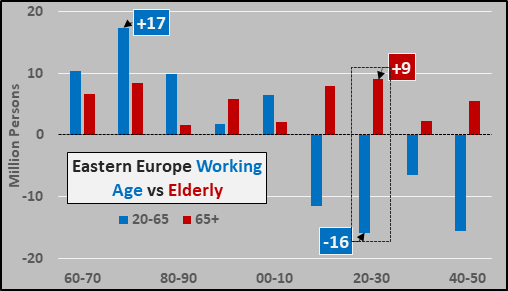
- 2020-2030…Working age depopulation of -9% (-16 million)
Working age Eastern European population change, per ten years, versus the growth of the elderly population (below).
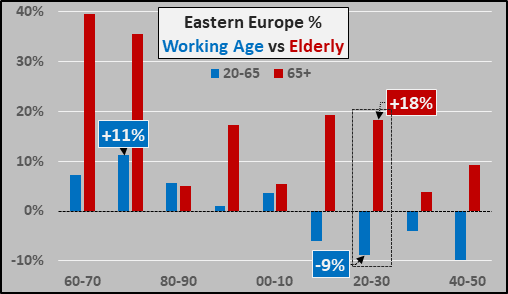
Percentage change, per 10 years, of working age versus elderly (below).
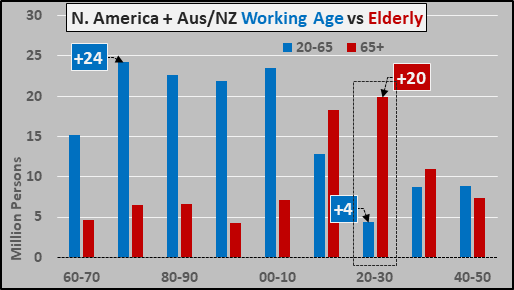
NORTH AMERICA+ (US of A / Canada + Australia / New Zealand)
- 397 million or 5.1% of global population
- 21% total global energy consumption
- 2020-2030…Working age population growth of +1.9% (+4 million) down from decade long peak of +19% (+24 million)
US working age population growth over the coming decade is only 1.6% but the relatively higher #’s for Canada, Australia, and New Zealand push up the average (below).
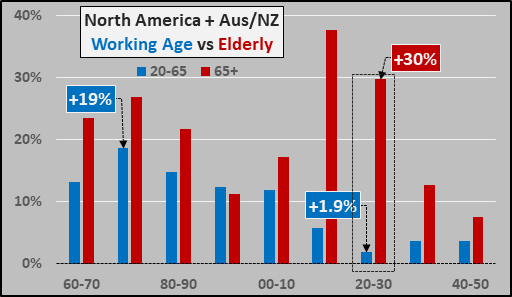
Percentage change, per 10 years, of working age versus elderly (below).
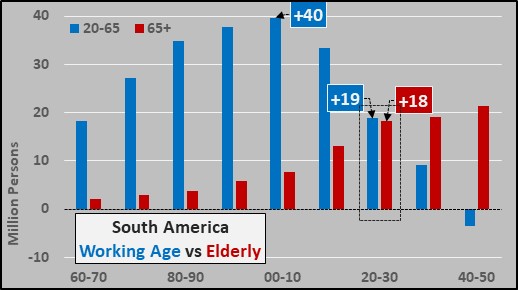
SOUTH AMERICA
- 427 million or 5.5% of global population
- 3.3% global energy consumption
- 2020-2030…Working age population of +7% (+19 million) down from decade long peak of +32% (+40 million)
Working age South American population change, per ten years, versus the growth of the elderly population (below).
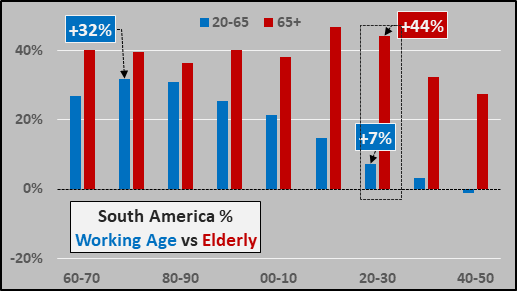
Percentage change, per 10 years, of working age versus elderly (below).
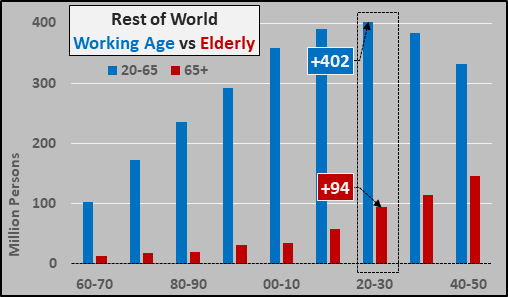
Rest of World (the nations w/ incomes less than $4,000 per capita annually, and average $1,600 in per capita income)
- 3.85 billion or 50% of global population
- 20% of global energy consumption
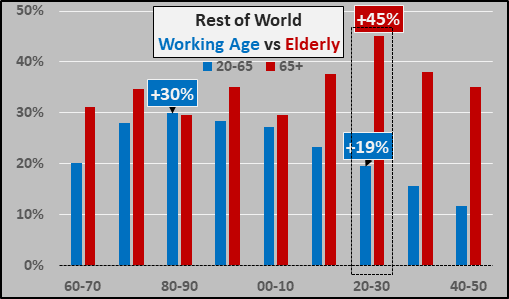
- 2020-2030…Working age population increase of +19% (+402 million) down from peak of +30% but at all-time high in total persons.
Working age population growth of Africa, Central America, Asia (excluding East Asia), etc. versus the growth of the same elderly populations (below). The impressive looking population growth here simply does not transfer to any significant rising demand and consumption as these nations are too poor and too dependent on import growth among wealthier nations. Sadly, these poor nations will only get poorer, following the current economic system.
Percentage change, per 10 years, of working age versus elderly (below).
Final Thoughts:
Over the coming decade, the current growth based system and paradigms will fall by the wayside. The global trickle-down mantra is already failing, and will entirely come apart. The impact will be bad for wealthy nations but even worse for poor nations. The real question is what will replace the current faulty system…and will it be any better? Invest accordingly.
-Population data from UN World Population Prospects 2019, (utilizing the overly optimistic Medium Variant).