Wolf Richter wolfstreet.com, http://www.amazon.com/author/wolfrichter
Even as “hedonic quality adjustments” perform miracles to repress surging new and used vehicle inflation.
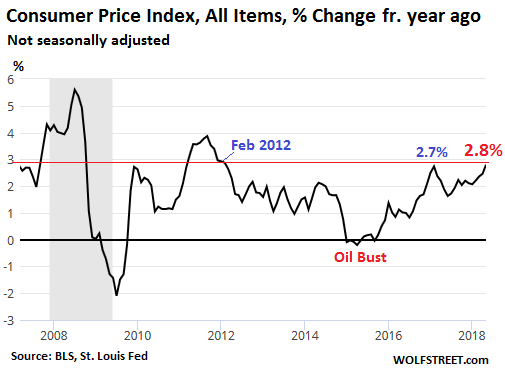
Consumer price inflation, as measured by the Consumer Price Index, released this morning by the Bureau of Labor Statistics, jumped by 2.8% in May from a year ago, after having already jumped by 2.5% in April. It was the fastest year-over-year rise since February 2012:
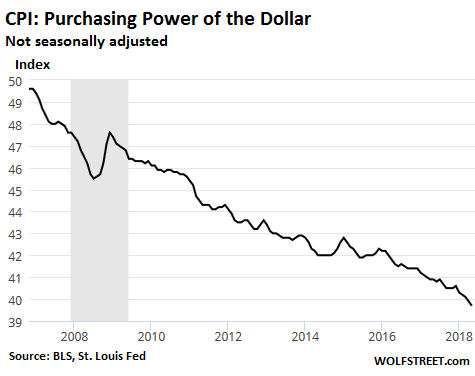
Inflation is just a nice way of saying that the dollar is losing its purchasing power, and that income earned in dollars is buying less and less, an experience consumers go through when they buy stuff. The purchasing power of the dollar dropped 2.93% in May from a year ago, the fastest drop since November 2011. The chart below shows the index of the dollar’s swooning purchasing power:
The CPI without food and energy rose 2.24% from a year ago, after having already risen 2.14% in April.
These year-over-year percentage changes in the Consumer Price Index are slower than what consumers experience in terms of actual price increases. Here are two big examples of how this discrepancy is happening: prices of used vehicles and new vehicles.
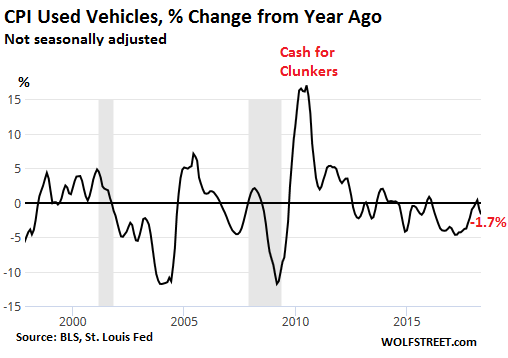
The CPI for used cars and trucks fell 1.7% in May from a year ago (not seasonally adjusted), according to the BLS. This index has been falling much of the time during the last decade with exception of the “Cash for Clunkers” period and its consequences, which took a whole generation of often perfectly good older cars off the road, and thus actually raised prices on what was left (the spike in this chart from 2010-2012):
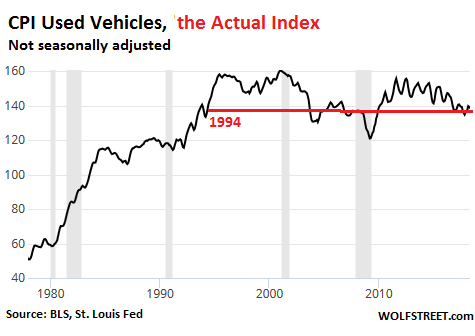
The chart below shows the actual index of used car- and truck-price inflation over the decades. Note that this CPI for used vehicles in May is at the same level as in 1994:
In reality, used cars and trucks cost a lot more today than they did in 1994. The big differences between reality and CPI are numerous adjustments, including most prominently “Hedonic Quality Adjustments.” When a model has quality improvements from one year to the next, the price index for that model is adjusted for the costs of these improvements, based on data provided by the automakers.
Quality improvements in vehicles include: Reliability, durability, safety, fuel economy, maneuverability, speed, acceleration, deceleration, carrying capacity, and comfort or convenience. Additional adjustments are made for added or deleted equipment.
This makes sense on some theoretical level, as vehicles have gotten a lot better over the decades. While consumers pay a lot more, they also get a lot more. That’s the theory behind extracting the costs of quality improvements from inflation data.
These adjustments lower CPI data compared to actual price changes that car buyers experience in reality. In reality, a five-year old compact car today costs a lot more than a five-year old compact car cost in 1994, and shoppers who want a five-year old car have to cough up the new prices and cannot buy anything with the amounts they were able to buy a five-year old compact in 1994.
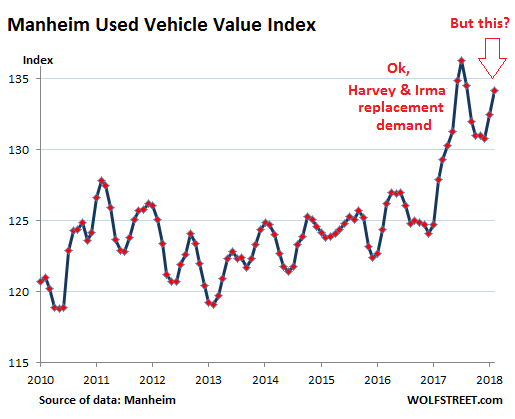
The Manheim Used Vehicle Value Index gives us a different view without hedonic adjustments. It measures used vehicle prices as they’re established at auctions around the country. Turns out, on this basis, used vehicle prices jumped 4.9% in May from a year ago. At 134.2, the index is up 11% from January 2010 while over the same period the used vehicle CPI by the BLS fell0.5%:
In the new vehicle department, a similar trend emerges: In reality, new vehicle prices have surged. In May, the average retail “transaction price” – after all incentives and discounts – per J.D. Power estimates, rose by about $1,200 from a year ago, to $32,380. That’s an increase of 3.8%.
And yet, believe it or not, the new vehicle price index by the BLS, thanks largely to hedonic adjustments, fell 1.1% from a year ago, and the actual index is about flat with March 1997:
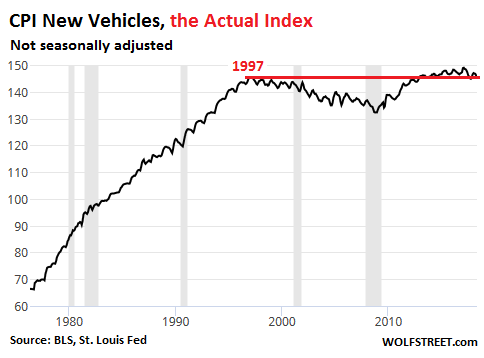
Note the mystery: Both used vehicle and new vehicle CPI surged until the mid-1990s, though vehicle quality improved over those decades as well. Then, suddenly, new- and used-vehicle CPI began to flat-line. I believe this distortion has largely to do with how the hedonic adjustments have been tweaked since the mid-1990s to repress overall and “core” CPI.
Used and new vehicles matter in the overall CPI, with a combined “relative importance” of 7.1% of the total index. And these hedonic adjustments are applied to other products as well, such as TVs, cell phones, and myriad other things.
But there are at least two problems with these hedonic adjustments: One, if they’re even slightly aggressive, their impact is cumulative and ends up producing systematically understated inflation, which seems to be case in the new and used vehicle data; and two, over the years, consumers have to deal with a life in reality that gets more and more expensive as the items that perform the same function, such as a five-year old compact car, simply cost a lot more than they used to. If consumers often feel in their pocket books that the official CPI data is a hoax, these hedonic adjustments — however logical they may appear in theory — are a reason why they feel that way.