Summary
- Technology stocks have been leading the market for some time.
- Recent valuations, sentiment and positioning reached extreme levels making us cautious in the sector.
- We favor heavy rotation out of technology for at least the next few months.
Technology has been a stellar performer since this bull market began in 2009.
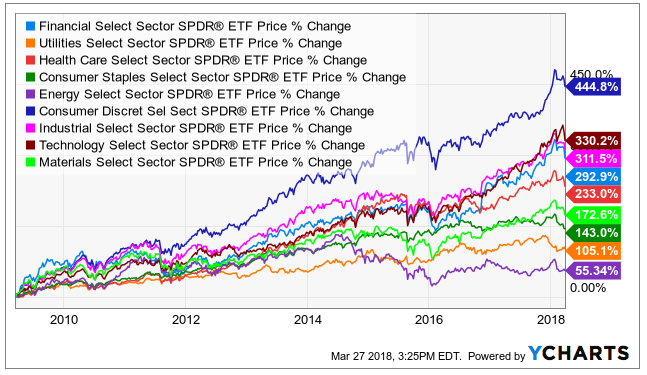
Of the large sector ETFs, only Consumer Discretionary Select Sector SPDR (XLY) has outperformed this sector. In stark contrast, Energy Select Sector SPDR (XLE) and Utilities Select Sector SPDR (XLU) have been huge disappointments during this bull market. Recent price action had gotten so extreme from technology that we decided to take a step back and examine whether a mean reversion was due.
FANG DEFANGED
As of March 9, 2018, the famous FANG group had handily beaten the broader market ETFs over the past 1 year.

WHAT IS PRICED IN?
A lot. To put it bluntly. We will take a brief example of Amazon (AMZN) to demonstrate our point. From a 50,000-foot level AMZN is a retailer. If we assume that it can match the 3% net margins of its competitor Walmart (WMT), and assume that ultimately on reaching steady-state AMZN will trade at a 15X multiple, then it will have to deliver some really spectacular sales to justify its current market capitalization.
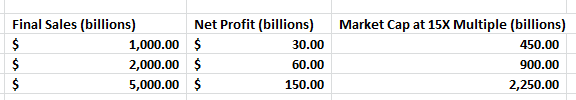
To put these numbers in perspective, keep in mind that AMZN’s market cap exceeded $825 billion recently and its sales were under $180 billion. So sure, it can grow, but if sales even increase 10-fold a decade from now from these lofty levels and AMZN delivers the 3% net after tax margins, the current market cap may have come close to discounting it.
THEY DON’T ALWAYS RING A BELL AT THE TOP
To show how extreme the outperformance had gotten, we show you a RATIO chart of the Nasdaq composite to the Dow Jones Utility Index going back to 1990.
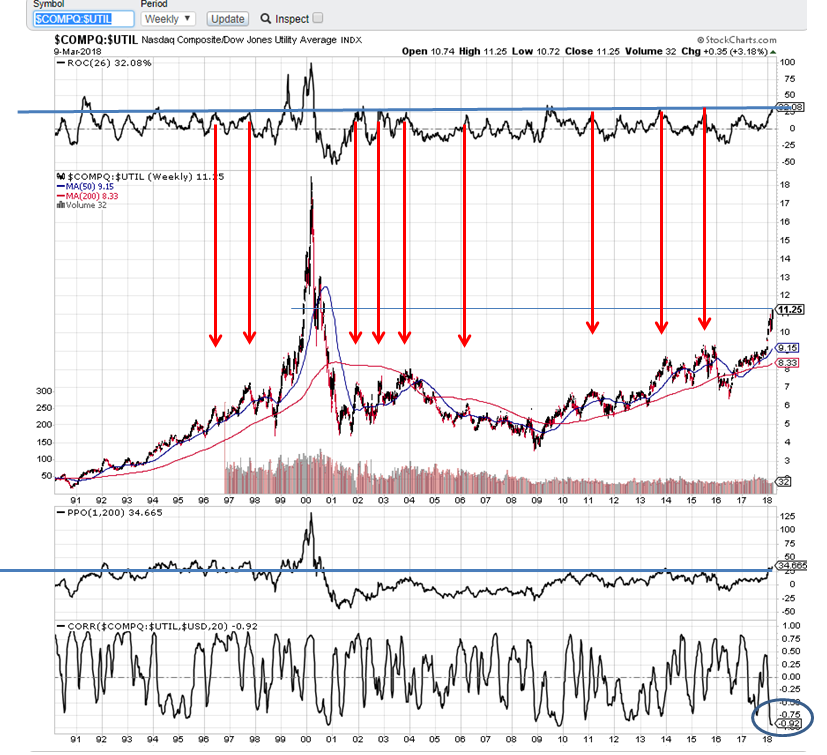
Source: Stockcharts.com
The ratio on March 9, 2018 was exceeded briefly for 9 months between October 1999 and June 2000. So technology has been this expensive relative to utilities for a brief time during what we know in hindsight was the biggest bubble of the past 3 decades. Now, one has to be careful using these as there are many industries that change and even fade over time.
For example, a coal mining ETF would likely continue to be a chronic underperformer over decades. A high ratio of technology stocks to coal mining stocks would not necessarily indicate that it is ripe for mean reversion. However, we feel comfortable in holding the thought that Utilities are not likely to fade away any time soon and hence this extreme ratio is worth taking note of.
The chart also has some other indicators also. At the top is the 26-week rate of change (ROC). This shows how quickly the Nasdaq has outperformed the Utility index. The current ROC has been exceeded only once outside the pure bubble phase. The red arrows mark the number of times that this or a similar level of ROC created the top for this ratio the next few months at least and we can see that almost every time this ROC marked an important top.
There are two sets of indicators at the bottom. The first shows how above its 200-week moving average this ratio is. Now in the 90s’ bull market, this stayed very high for almost a decade. But that was a gigantic bubble and unlikely we will repeat that. Outside of that decade, this ratio has never been so high above its 200-week moving average.
So the question is whether this is about to mean-revert or are we starting another 90s type bull market for tech? We are not certain at this point. However, we do feel that the current hype of autonomous transportation, artificial intelligence and cryptocurrency mining far exceeds the deliverable results over medium time frames.
Finally, right at the bottom is the correlation with the USD. Why USD? Well Technology companies derive a very significant chunk of their earnings from overseas while Utilities are about the most domestic group in the stock market. You can see currently this ratio is showing a very high NEGATIVE correlation to the US dollar. That makes sense as the weaker USD gets, the better tech stocks’ earnings projections get. Utilities don’t benefit one bit from this as they are almost exclusively domestic.
CONCLUSION
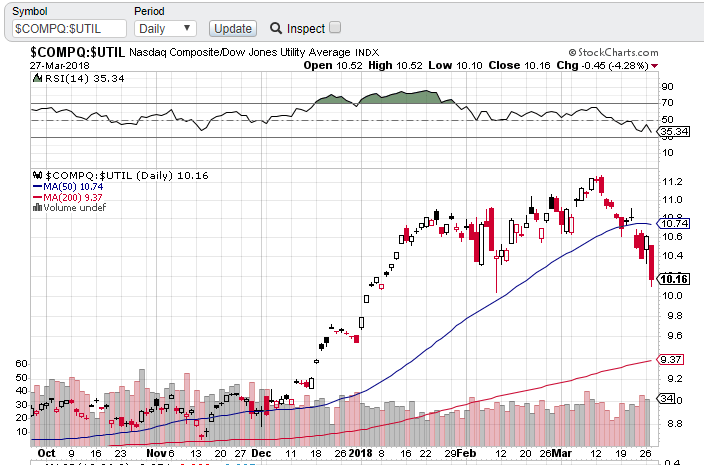
The current selloff in technology was perhaps precipitated by the infamous UBER incident. Nvidia (NVDA) suspending autonomous self driving car tests added fuel to the fire. But the bigger trigger for us was the fact that the sector was running on fumes and price action had gotten way ahead of earnings.
Investing is about probabilities and not certainties. The current run up in technology is an extreme outlier aided by a weakening USD, tax cuts and complete euphoria is this sector. Technology companies are priced for perfection and we think technology companies weighting in the stock market is the biggest risk in the market. As Shawn Tully had eloquently put it:
At the start of 2017, FAAMG Inc.’s total market cap was $2.09 trillion, and it accounted for 11.06% of the iShares Core S&P 500 ETF managed by Blackrock. By the close of last year, its value had surged to $3.01 trillion, or 44%, raising its weight in the ETF to 13.36%. In other words, your investment in FAAMG rose by one-fifth last year, and the portion of your total ETF portfolio sitting in FAAMG increased by 2.3 percentage points.
The broader technology sector makes up a quarter of the S&P 500 market cap and as long as tech struggles, the broader indices will have a hard time getting their game faces on.
We also think the USD is likely to bounce from its extreme weakness and technology company EPS estimates will be downgraded. From a sector rotation standpoint, we would sell some technology and rotate into out of favor utility names. Since our initial call to our subscribers on March 9, Utilities have outperformed by 10%. But we think there is definitely more of this in store.
As to the question of whether the technology sector will lead the market again, we stole a quote from our favourite Star Trek Episode.