by Umar Farooq
Vix gauge – which measures the expected short-term turbulence of the S&P 500 and doubles as a fear index – heading for its lowest closing level in over two decades. Vix has fallen to just 9.84 today, which if maintained would be the lowest closing level since December 1993. Earlier on Monday it touched a low of 9.72, which is the most subdued intraday low since early 2006. The European Vix equivalent has also tumbled today, to its lowest since March.
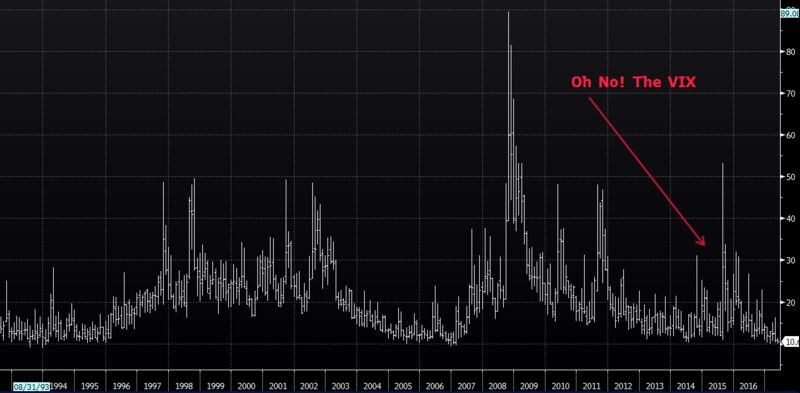
Source: bloomberg
This is what happens when markets trend lower for a while. In all three examples when the VIX went below 10, markets were more than five years into recoveries from major plunges: The 1987 crash, the dot-com implosion in 2000 and the financial crisis in 2008-09. In each of these cases, markets afterward rose double-digit rates for a good long while as the VIX fell.
Specifically, this would be the fourth time ever that the VIX has closed below 10 after at least a month above that level. The last time this happened was in January 2007, which marked the second time in two months for a signal, which also flashed in November 2006. The only other signal went off in January 1994.

Source: schaeffersresearch
“With stocks powering ever higher—the Nasdaq Composite hit another record last week—it would be easy to imagine that the good times will last forever. But the CBOE Volatility Index, or VIX, often called the fear index which is the one indicator that has often been a good contrarian signal has been urging caution. Returns for the S&P 500 index have been positive between one and three months after the VIX previously hit low levels, says David Rosenberg, Gluskin Sheff’s chief strategist. But over a one-year horizon, returns have been negative, whether measured on a median or mean basis. The one-year return for the 2007 reading was negative 7.33—the worst of all 14 instances when the VIX closed below 10.11 level. On average, the one-year return in these 14 cases was negative 1.38%, far below the 7% annualized return of the S&P 500 index since 1990.” barrons
Nicholas Colas, chief market strategist at Convergex, cites 10 equity “puts” that help explain the low volatility and the march higher for U.S. and global equities. They include what some believe is the Federal Reserve’s refusal to let markets fall too much, and the expectation that President Donald Trump will get tax reform approved before the 2018 midterm elections.
In short, just because the index is plumbing 10-year lows this week does not necessarily mean that complacency has overtaken the market. If investors take the viewpoint that a big market drop is likely in the next 30 days, investors will pay more for options that would profit off of such a decline, and the VIX will rise in reflection of this “fear.” More generally, expectations of large market moves to either the upside or downside will send the index higher. Lack of volatility is viewed by many as a net positive, but at the extremes it can indicate that too much complacency has come into the market. When there’s no fear as to what the market may do, traders, investors, and even institutional participants can stray from, or “relax,” their risk management rules. This can lead to a frothy market environment, which can sometimes reverse course very quickly and rather violently.
Except the way the stock market is now it has nothing to do with the economy until they crash so hard you end up losing every cent you saved for retirement and only the billionaires who cause the crash get bailed out…. at our expense….