Dear Investors:
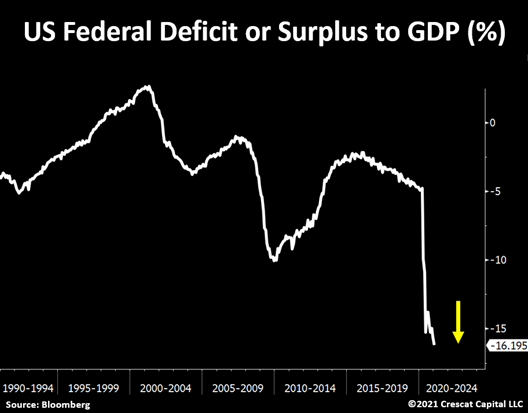
The year is just getting started and the US fiscal deficit already reached another record, now at its worst level in 70 years. The Fed is facing its worst predicament yet. The current fiscal spending path will lead to record Treasury issuance this year. Foreign investors are unlikely to be the ones funding this operation. With 2020 as a guide, there are no buyers of any size for those securities outside of US banks and the Fed. Major foreign holders of US debt only bought about 5.2% of all Treasuries issued last year. In the face of this enormous new government debt issuance, the Fed faces the impossible task of continuing to prop up already historic asset bubbles while also preventing inflation. The current extreme fiscal imbalances put the central bank on a crash course to fail at both.
A Tsunami of Debt Issuance
In March of 2020, lawmakers passed the $2.2 trillion CARES Act bill and an additional $900 billion of stimulus in December. However, with the decline in tax revenues and other discretionary and non-discretionary outlays, the government had to issue $4.4 trillion of net new debt in 2020 to fund these programs. The Fed purchased $2.4 trillion of these Treasuries, or 54% of the total issuance, which equates to an average of $197 billion per month. This year, the Fed has announced that is committed to purchasing just $80 billion per month, but with fiscal spending likely to be significantly higher, it is simply not credible that the Fed is going to buy 60% fewer Treasuries than it did last year. The math does not add up. The Biden administration is now planning on a two-stage stimulus package: rescue and recovery. The “rescue” will be close to $1.9 trillion which needs signing in the coming weeks before unemployment benefit programs are exhausted of money. The “recovery” part, still being discussed, could be as large as $3 trillion. That puts Biden’s rescue and recovery package cost close to $4.9 trillion for the American taxpayers, compared to the $3.1 trillion that was passed in 2020. In our analysis, the Fed will need to substantially increase its planned quantitative easing. By our math, the level of QE this year that will be necessary to stop interest rates from rising appears to be closer to $300 billion per month than the planned $80 billion.
Inflation Starts with Commodities
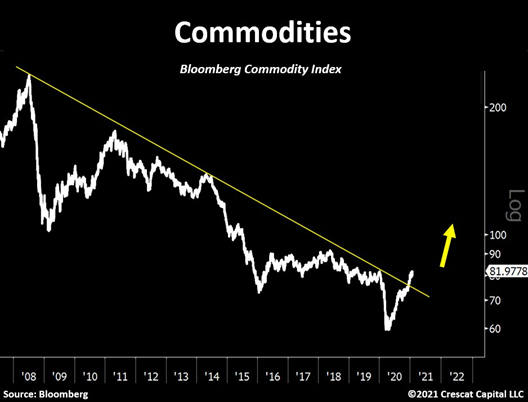
Crowded long duration growth stocks and fixed income securities are at historic valuations today. Rising interest rates place these instruments at risk. The new Treasury supply is naturally forcing rates higher. To keep rates down and prevent asset bubbles from bursting, the Fed must step in as the lender of last resort to purchase these Treasury securities. The problem is that this form of interest rate suppression, through money printing to finance large fiscal and trade deficits, is highly inflationary. In such an environment, investors will seek hard assets for protection. For many reasons, the path of least resistance at this stage in the economic cycle is indeed the inflationary one. After years of underinvestment in the basic resources of the “old economy”, the world is facing commodity supply shortages. When combined with the fiscal stimulus driven boost in demand, hard assets are already starting to catch fire. A commodity boom is contributing to reflexive macro inflationary pressures, including investment demand for inflation protection, as well as rising industrial demand in a fiscal stimulus driven economy attempting to both recover from Covid and transition to a cleaner, greener economy. Rising inflation starts with rising basic materials, energy, and agriculture prices. The recent 12-year breakout in commodities is rock solid.
The Great Rotation
Rising inflation expectations are a disaster for overvalued large cap growth stocks, including mega cap tech, as it shrinks the valuation multiples that investors are willing to pay for these securities. Given all the above factors, our analysis leads us to strongly conclude that we are in the early innings of what we are calling a “great rotation” out of long duration overvalued large cap growth and fixed income securities and into undervalued commodities and basic resource stocks.
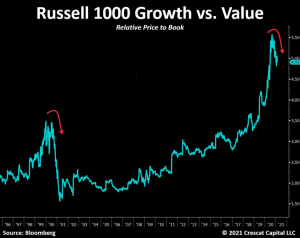
The setup today is not unlike the 1972 Nifty Fifty and 2000 Dotcom bubbles. The difference today is that we are starting from even more extreme valuation disparities. Look at the price to book differentials on the Russell 1000 Growth versus Value indices, for instance, today compared to 2000. Notice how large cap growth stock performance relative to their value counterparts appears to have just rolled over and likely has much further downside from here.
Discount Rate Assumptions Too Low
Given historically low-rates and credit spreads in today’s market, we suspect that investors are using discount rates that are simply too low in their models to value long-duration assets. The risk-free rate which the Fed has pegged at zero on the short end of the yield curve today and the discount rate for risky long duration assets are two different things. Investors need to apply an equity or duration-based risk premium on top of Treasury bill rates to get their own hurdle rate or required rate of return. Do not forget to incorporate your own expected long-term inflation rate into your overall discount rate. Today, this should be higher than the implied inflation based on TIPS. The idea of the discount rate is to allow for a margin of safety.
We also suspect that growth rate assumptions are too high today by most investors, especially for large cap growth and mega cap tech stocks today. These companies face the law of large numbers. They cannot grow at a fast pace forever. Terminal growth rates that exceed long-term GDP growth cannot be sustained. Over the long-term, companies do not grow to overtake the economy. We are cautious when most of the value of a stock in a DCF resides in the terminal value.
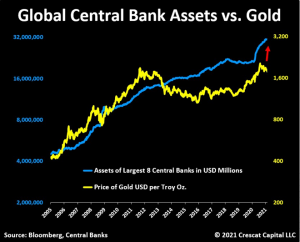
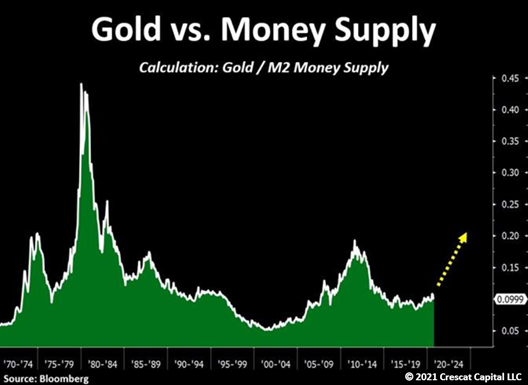
Money Printing Drives Gold
Global central bank money printing is one of the primary drivers of the gold price. Our current valuation target for gold based on the level of central bank assets and the inelastic supply of above-ground gold is $3,200/oz. Note, this is a rising target.
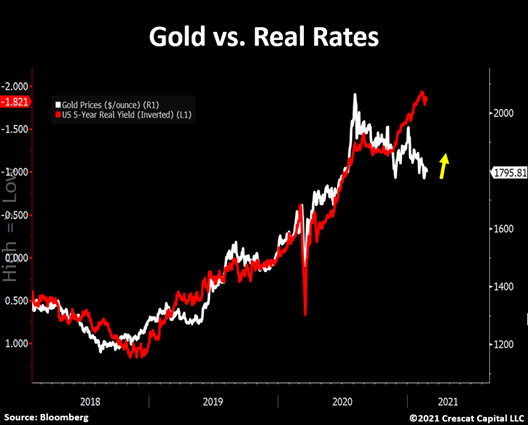
Declining Real Rates Drive Gold
We think the Fed will have no choice but to increase its QE program and, as a result, inflation expectations should continue to rise faster than nominal interest rates. To recall, real rates tend to lead the way for precious metals, particularly gold. We believe the recent decline in 5-year real yield (inverted in the chart below) suggests that gold should be headed towards new highs again soon.
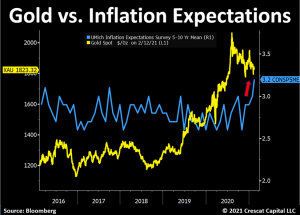
Long-term inflation expectations in the University of Michigan survey just jumped above 3%, indicating even lower real rates than implied in the TIPS market.
Taxpayers on the Hook
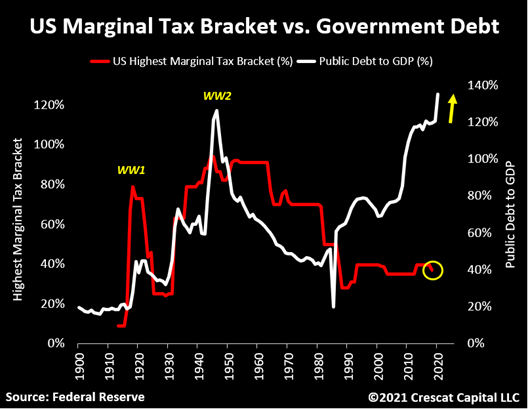
We all know what is coming. Ultimately, the Fed will not be able to be the only buyers of last resort for Treasuries to allow the government to run extreme fiscal deficits. US taxpayers will be on the hook. As we have seen throughout history, an increase in income tax rates tends to follow a period of large government spending. It is only a matter of time until this becomes an even more discussed topic. So far, today’s narrative is all about how big the fiscal stimulus is going to be. If nominal interest rates continue to rise and threaten the government funding situation, policy makers will have to redirect their focus towards the debt problem. Nonetheless, tax increases are inevitable and that is indeed negative for risky assets. Yes, the equity market did not have significant issues when tax rates were trending upward and reached 94% at the end of World War II. However, with stocks near record multiples across almost all fundamental factors, we think risky assets cannot undergo such a tightening impact in the economy at today’s price levels.
For the people calling for the Roaring 20s, back then not only was inflation falling but tax rates were also in a downtrend. There is no way that either of these factors will be in play today.
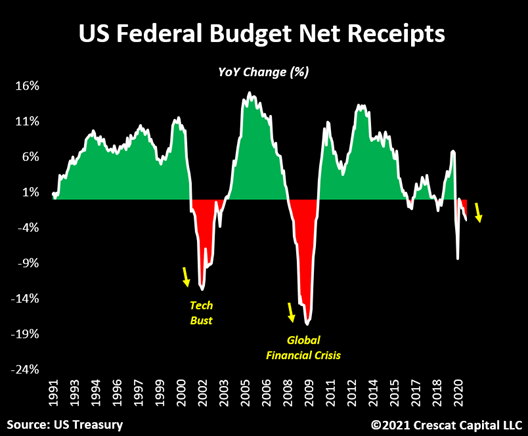
The one big problem, however, is that not only is fiscal spending surging but US Federal net receipts are also starting to turn lower again. As of January 2021, US federal receipts are down -3% on a year over year basis.
Inflationary Wealth Transfer
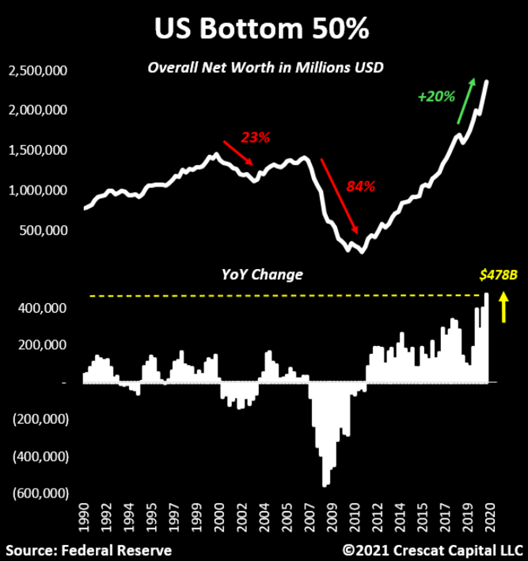
Note that we saw a much worst decline in federal tax receipts during the tech bust and the global financial crisis than today. In our view, this difference has a lot to do with the size of the government stimulus and the way it was executed. As we pointed out in our latest research letter, we just saw the largest wealth transfer from the government to the people in the last 30 years. As a result, while lower classes lost 84% of their net worth during the Great Recession, this time we saw the largest annual increase in wealth in the middle of a depression like economic downturn. In aggregate, US households’ net worth increased by $11.7 trillion dollars in 6 months since the recession began. This is not like the disinflationary times we had after the global financial crisis. It is quite the opposite. Today, we have inflationary pressures on both the demand and supply side of the economy.
Post Pandemic Commodity Shortages
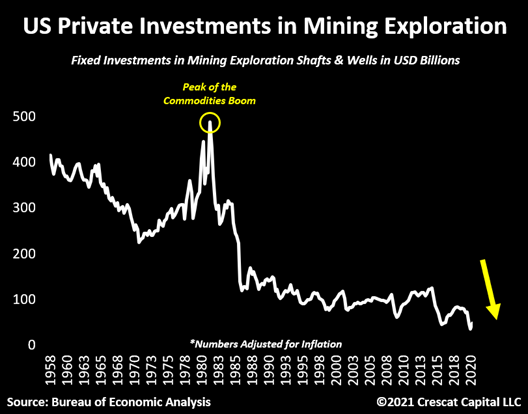
Similar to the issues we had after the Spanish Flu in 1919, inflationary pressures keep building. Back then, consumer goods prices began to rise due to a raw material shortage problem. Commodity producers were running well below their historical capacity, resulting in a sharp upward move in prices. This time, on the other hand, the pandemic already started after several long years of under investments in the commodities market. To highlight, investments in mining exploration are at a 62-year low! We strongly believe that there will be major supply/demand imbalances in the next years as part of the current macro environment. This scenario is beyond bullish for tangible assets such as commodities.
Rising Commodity Prices Lead to Broader Inflation
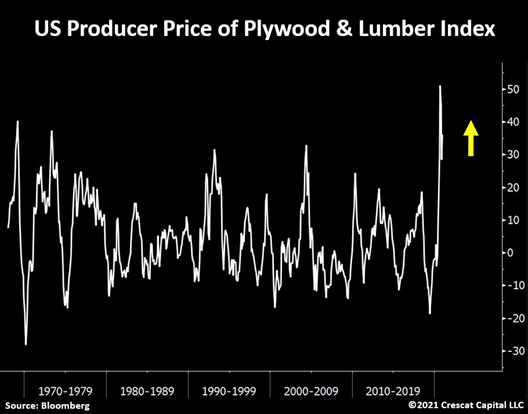
Cost-push inflationary forces will likely come from steep rises in commodity prices. This trend has already started. Lumber and plywood prices are not only near record levels, but they are also rising at their fastest pace since 1974. Agricultural commodities, base metals, gasoline, natural gas, are all up over 20% on a year over year basis. The Fed is indeed aware of the upcoming inflationary forces, but it cannot do anything to prevent it from happening. The current economy remains largely dependent on extreme monetary and fiscal policies.
Early in a New Commodity Super Cycle
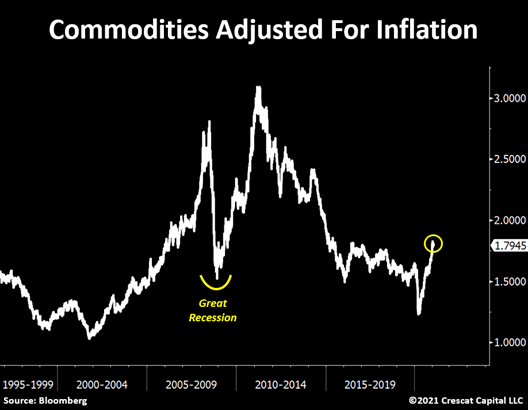
But the game is only getting started. When adjusted for inflation, commodities are just slightly above the worst levels of the Great Recession. We are likely entering a super cycle period. Just remember, commodities are your highway from the old to the new economy. When their prices go up, the whole investing landscape is set to change.
More than Just a Silver Squeeze
The macro stage is set. The genie is out of the bottle. The list of macro, fundamental and technical reasons to be long precious metals today is extensive. It is more than just a “short squeeze” in silver. It is about:
- Fiscal recklessness
- A massive debt buildup
- Monetary dilution to suppress interest rates
- Lack of fundamentally cheap assets that yield more than inflation
- A worsening current account deficit issue
- Lack of new precious metals discoveries after long-years of underinvestment in the space
- Reluctance of miners to spend capital on exploration and development, even as metal prices continue to rise
- The supply cliff issue among producers as they deplete their reserves, shortening their average mine life, while not successfully replacing reserves with new deposits to expand their production
- Gold and silver remain near record lows relative to money supply and the monetary base
- The largest wealth transfer in history from the government to the people that creates major inflationary pressures
A New Secular Bull Market for Gold
Finally, most importantly, policy makers are being forced to run the economy hot as inflation expectation continue to pick up faster than nominal interest rates. In our view, this is the beginning of a secular bull market for precious metals.
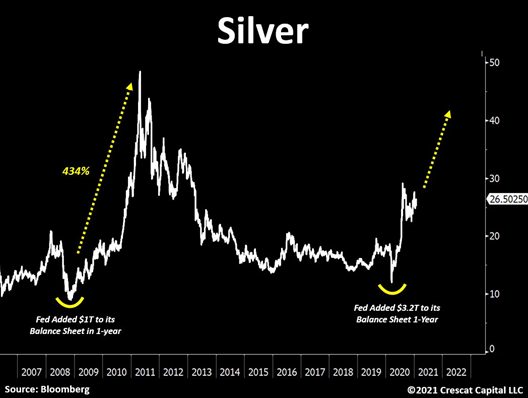
The Most Undervalued Macro Asset
Looking back in history, periods of extreme monetary policies are followed by strong rallies in silver. Late-2008 to 2011 is a great example of that. Back then, the Fed added close to $1 trillion of assets to its balance sheet in 1-year and silver appreciated by over 430% in the next years. In the 12 months so far, the Fed did over 3 times that amount of monetary stimulus. We believe silver is poised to move much higher. It is, in our view, the most undervalued macro asset in the financial markets today.
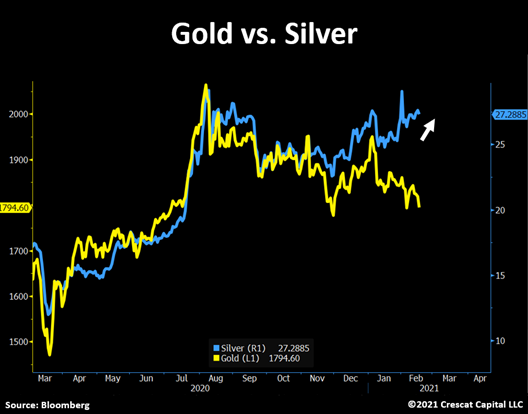
Silver Leading the Way
It is truly remarkable what is going on with the precious metals industry. Silver was up 48% in 2020 and is now up another 5% this year already. The strength of silver has never been so evident. It has been stealthily rising in the last several weeks while gold and miners continue to pull back, indicating that the overall pullback in gold and the Philadelphia Gold & Silver mining index since August is likely about to end. It is important to see silver holding up so well and leading the way. We believe we are near an upward inflection point for precious metals that continue to look historically undervalued and in the early stages of a secular bull market. We remain focused on building a portfolio of large, high-grade gold and silver deposits in strategic regions of the world. We believe our timing will prove to be outstanding given the recent industry-wide pullback. As an activist investor, with the right properties, technical expertise, and focused capital for exploration, we are able to unlock value in high-quality gold/silver explorers. It is also the right metals price environment, which makes it even better.
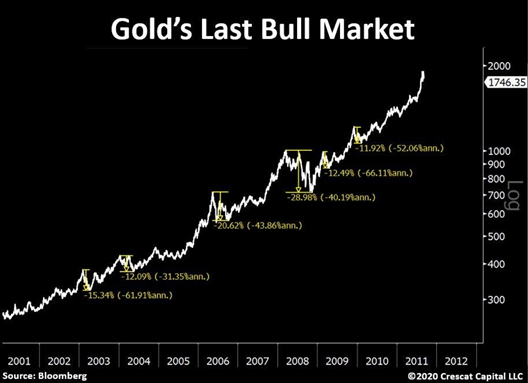
Pullbacks Are Opportunities
See in the chart below how gold had at least six large corrections in its last bull market. Investors who were able to identify the long-term opportunity and added to their positions at cheaper levels were the ones to fully capitalize on the bull run. Aside from gold being historically undervalued at its current price, silver at sub $30/oz is perhaps the most attractive asset to hold in today’s environment. In our view, it is time to continue to build a strong position and profit from what we believe is one of the most bullish setups in silver history.
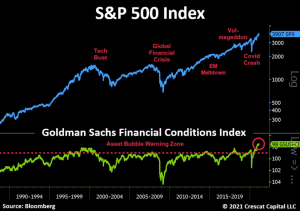
Asset Bubbles Burst
Are people partying like it’s 1999? Not even close. Speculation in today’s financial markets is a party like never before. Fundamentals are irrelevant. Value investing is over. Short sellers are gone. Stock option volume has gone bananas, overall equity volume too. “Get rich quick” ads are everywhere. Euphoric retail investors are buying in. When financial conditions are too easy, we get asset bubbles. The flood of liquidity provided by central banks and governments has created speculative manias in virtually all asset classes of the financial markets, except commodities. But asset bubbles are unsustainable. Loose financial conditions, including a low 10-year yield and record tight credit spreads, have been an important driver for risky assets. The game is changing. The yield curve is steepening, long-term nominal rates are rising, and stocks, which are long duration assets, are now in danger.
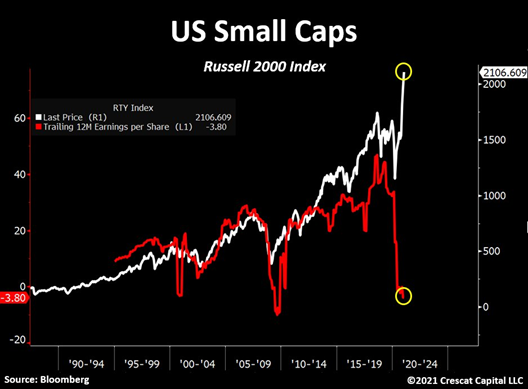
Stocks Way Ahead of Fundamentals
You do not want to be the last one standing when the music stops. The Russell 2000 small cap index is in “la la land” too, with stock prices completely diverging from actual fundamentals, pricing in way too much improvement in earnings before the fact.
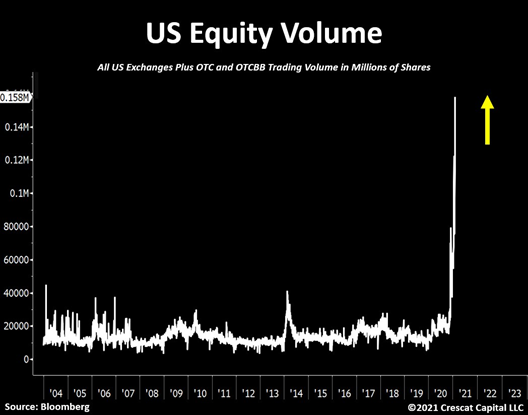
A Speculative Mania
With all this liquidity slushing around, equity markets are turning more and more into a casino. See below the aggregate volume for US stocks today. It is just about four times its historical average while at record prices.
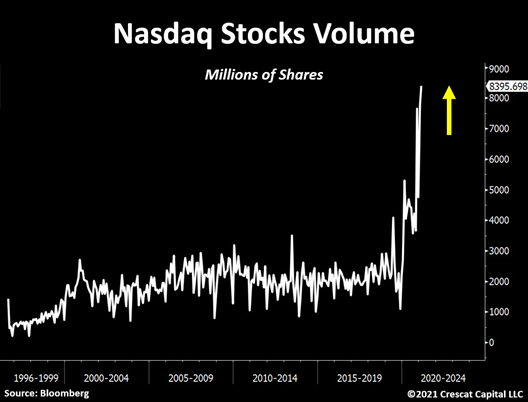
For those suggesting that we should look further back, here is the volume for Nasdaq stocks since the 90s.
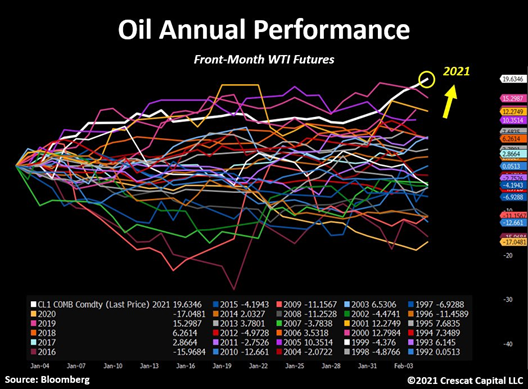
Oil
We are also seeing significant moves in the oil market. WTI is having its best year-to-date performance in 30 years. We believe oil can continue to move higher in this macro environment and therefore we hold significant long positions in energy stocks in our Large Cap strategy.
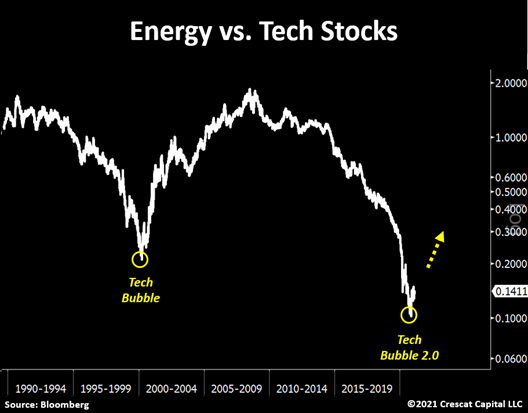
We often hear how energy stocks have already had a big move in the last months. However, when we step back, the value proposition for buying still historically undervalued oil companies relative to high-flying tech names remains incredibly attractive. The energy to tech stocks ratio remains near all-time lows.
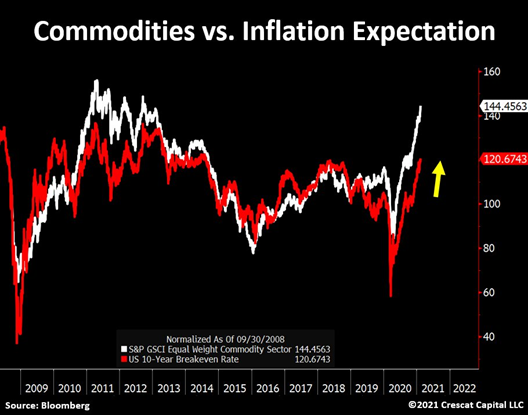
Commodity prices have largely impacted inflation expectations over time. The chart below is a perfect reflection of that. The two lines look almost the same and suggest that 10-year breakeven rates are ripe to move significantly higher.
We have been presented with a historic opportunity to capitalize on the “Great Rotation” by selling record overvalued financial assets and buying undervalued commodities and resources equities. That is how Crescat is positioned today. For more information on investing in one of Crescat’s strategies please contact a Client Services Associate. Marek Iwahashi and Cassie Fischer’s contact information can be found below.
Sincerely,
Kevin C. Smith, CFA
Founder & CIO
Tavi Costa
Partner & Portfolio Manager
Rich Johnson
CFA Data Scientist
For more information including how to invest, please contact:
Marek Iwahashi
Client Service Associate
303-271-9997
Cassie Fischer
Client Service Associate
(303) 350-4000
Linda Carleu Smith, CPA
Partner & COO
(303) 228-7371
© 2021 Crescat Capital LLC
Important Disclosures
Performance data represents past performance, and past performance does not guarantee future results. An individual investor’s results may vary due to the timing of capital transactions. Performance for all strategies is expressed in U.S. dollars. Cash returns are included in the total account and are not detailed separately. Investment results shown are for taxable and tax-exempt clients and include the reinvestment of dividends, interest, capital gains, and other earnings. Any possible tax liabilities incurred by the taxable accounts have not been reflected in the net performance. Performance is compared to an index, however, the volatility of an index varies greatly and investments cannot be made directly in an index. Market conditions vary from year to year and can result in a decline in market value due to material market or economic conditions. There should be no expectation that any strategy will be profitable or provide a specified return. Case studies are included for informational purposes only and are provided as a general overview of our general investment process, and not as indicative of any investment experience. There is no guarantee that the case studies discussed here are completely representative of our strategies or of the entirety of our investments, and we reserve the right to use or modify some or all of the methodologies mentioned herein.
Separately Managed Account (SMA) disclosures: The Crescat Large Cap Composite and Crescat Precious Metals Composite include all accounts that are managed according to those respective strategies over which the manager has full discretion. SMA composite performance results are time weighted net of all investment management fees and trading costs including commissions and non-recoverable withholding taxes. Investment management fees are described in Crescat’s Form ADV 2A. The manager for the Crescat Large Cap strategy invests predominatly in equities of the top 1,000 U.S. listed stocks weighted by market capitalization. The manager for the Crescat Precious Metals strategy invests predominantly in a global all-cap universe of precious metals mining stocks.
Hedge Fund disclosures: Only accredited investors and qualified clients will be admitted as limited partners to a Crescat hedge fund. For natural persons, investors must meet SEC requirements including minimum annual income or net worth thresholds. Crescat’s hedge funds are being offered in reliance on an exemption from the registration requirements of the Securities Act of 1933 and are not required to comply with specific disclosure requirements that apply to registration under the Securities Act. The SEC has not passed upon the merits of or given its approval to Crescat’s hedge funds, the terms of the offering, or the accuracy or completeness of any offering materials. A registration statement has not been filed for any Crescat hedge fund with the SEC. Limited partner interests in the Crescat hedge funds are subject to legal restrictions on transfer and resale. Investors should not assume they will be able to resell their securities. Investing in securities involves risk. Investors should be able to bear the loss of their investment. Investments in Crescat’s hedge funds are not subject to the protections of the Investment Company Act of 1940. Performance data is subject to revision following each monthly reconciliation and annual audit. Current performance may be lower or higher than the performance data presented. The performance of Crescat’s hedge funds may not be directly comparable to the performance of other private or registered funds. Hedge funds may involve complex tax strategies and there may be delays in distribution tax information to investors.
Investors may obtain the most current performance data, private offering memoranda for a Crescat’s hedge funds, and information on Crescat’s SMA strategies, including Form ADV Part II, by contacting Linda Smith at (303) 271-9997 or by sending a request via email to lsmith@crescat.net. See the private offering memorandum for each Crescat hedge fund for complete information and risk factors.
Disclaimer: This information is only for educational purposes. Do not make any investment decisions based on the information in this article. Do you own due diligence or consult your financial professional before making any investment decision.