BY SRSROCCO
While the silver price is trading at another important short-term technical level, the underlying fundamentals continue to improve. Since silver peaked at $19.75 at the beginning of September, it has been correcting lower to key support levels. As I mentioned in my last update, the silver price would like correct back down to a key support level before moving higher. And, if history is a guide, there is a likely price where that turnaround will occur.
However, it is essential to understand that technical analysis is only one aspect that guides the silver market price. Another more important factor is the improving fundamentals for precious metals as the Fed, and central banks begin to ramp up QE (money printing) once again. Of course, Fed Chairman Powell says the $60 billion a month in Treasury purchases is NOT QE.
I got a good laugh from Sven Henrich (northmantrader.com) response in his article Control:
Don’t call it QE they say, but ignore the fact that they are running a program equal in size to the annual US military budget. At $60B that’s exactly what it is. Massive
Fed Chair Jay Powell: The economy is in a good place. Now here’s a $60B per month Treasury bill buying program, multiple rate cuts and daily repo operations. How stupid do they think we are?
If the U.S. economy is in such a GOOD PLACE, then why does the Federal Reserve need to buy $60 billion a month in U.S. Treasuries? And, as the Northman trader stated, the Fed Treasury purchases are equal in size to the U.S. military spending. According to U.S. Government 2020 fiscal budget, the Department of Defense will spend $718 billion this year. Thus, $60 billion multiplied by 12 months is $720 billion.
That puts it all into perspective. The amount of U.S. Treasuries, the Federal Reserve, is buying a month, is approximately the same amount the military is spending. This is nothing more than SMOKE & MIRRORS to keep the sheep asleep.
Even with the Fed lowering interest rates, continuing repo operations until January 2020, and the $60 billion a month in U.S. Treasury purchases, the Dow Jones Index is still trading near the same level it was at the end of 2017. Sure, we could see the Dow spike higher if the U.S.-China trade agreement is successful, but the underlying fundamentals of the U.S. and global economies continue to weaken.
Which means, the reason to own precious metals will only improve as the Fed and central banks lose control of the QE and zero interest rate policy. This is not an IF, but WHEN.
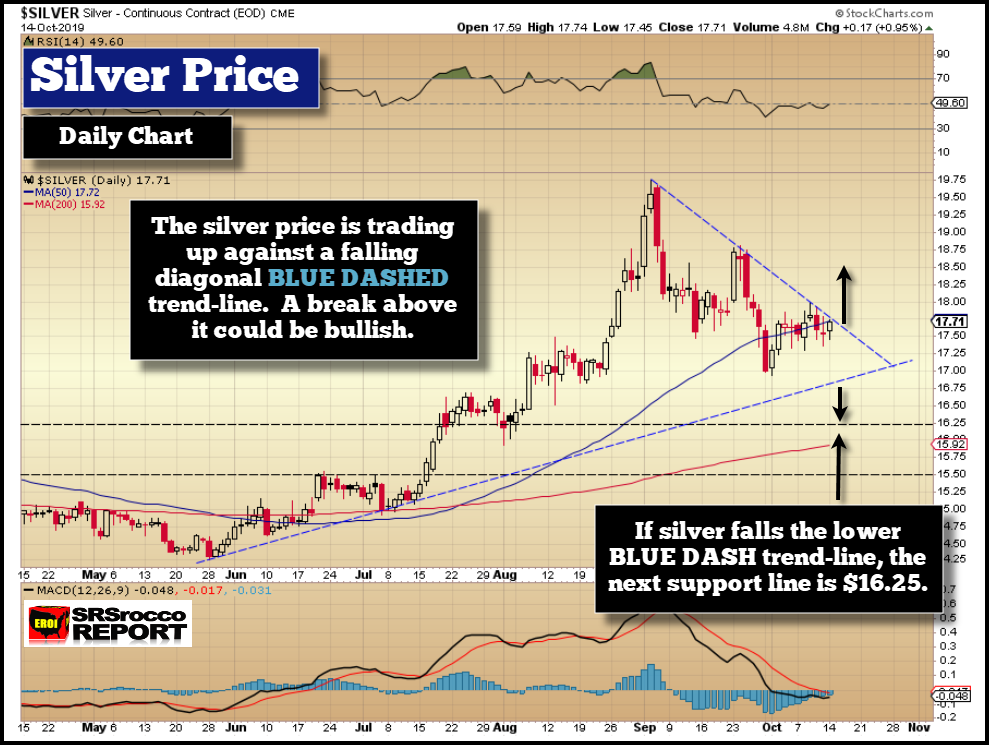
With that being said, let’s look at where the silver price may head over the short term. Currently, the silver price is trading within another triangle formation. As of the close yesterday, silver closed up against upper triangle formation:

There is no coincidence that silver stopped right at the upper part of the triangle formation for the past four days. When stocks and commodities trade in this pattern, if it breaks above that diagonal line, it would be bullish short term. However, the gold and silver prices have opened lower in U.S. markets this morning. So, it doesn’t look like it will break above that upper triangle trend line, but we don’t know what tomorrow will bring.
If silver does break above that trend line, it could move up higher for a short period. But, we still must consider the COT REPORT structure. Currently, the commercial short position is still near its highs, suggesting there may be a continued correction in the silver price until the shorts have liquidated a significant portion of the positions. Here is the current COT Report for silver. While we may see silver sell continue to sell off over the next few weeks or month, there is a positive sign:

The green arrows show where the net commercial short position was near a high, and the red is when it was at a low. A high commercial net short position means the silver price has reached a short-term top, and the opposite is true when the net commercial short position is at a low. The following silver chart will show the price at the time of these highs and lows in the commercial net short position:

When the commercial net short position was near a high on Feb 26th, the silver price was $15.83. By the time the commercials liquidated the short positions to be at a net-zero on May 28t, the silver price fell to $14.32. As of the current closing date (Tuesday) on the COT Report, silver was trading at $17.80, nearly $2 higher than on Feb 26th. So, with the commercial short positions near a high, the silver price is $2 higher than what it was on Feb 26th.
From Feb 26th to May 28th, the silver price only fell about $1.50. If the same trend takes place, then the silver price would fall right to the critical 50 Month Moving Average shown below at $16.39:

As I have stated several times in articles and video updates, the IMPORTANT KEY LEVEL was the 50 Month Moving Average which silver has been below since 2013. When it finally broke above it in a big way in September, it’s not uncommon for a stock or commodity to retrace that key resistance, now turned support level before moving higher. Thus, if silver corrects back down to that $16.39 level, the commercial short positions will likely be close to a net-zero.
Now, there is no coincidence that the monthly silver price closed right under that important $18.50 level shown in that large red monthly candlestick. While we can blame the market makers for “Painting the chart” by keeping silver below that key technical level, they can’t stop the improving fundamentals that will push the silver price higher over the next several years.
Here are a few words for those who continue to believe technical analysis is worthless in a rigged market. There are two separate events taking place in the market today:
- Stocks, bonds, real estate, commodities, and precious metals are trading via technical analysis within a highly manipulated financial system. As stated above, by the Fed buying $60 billion a month of U.S. Treasuries, the same as the monthly military spending, should give an idea of how much the central banks are propping up the markets. So, stocks, bonds, real estate, commodities, and precious metals will continue to trade within that manipulated system until the Fed, and central banks lose control.
- When the Fed and central banks lose control of the financial system, and they will, then technical analysis will no longer be a good indicator of the market price. Instead, the surging demand for the precious metals by investors looking to protect their wealth will finally be trading in a free market that will likely go hog-wild.
So, once again. If you want to leave comments on how useless technical analysis is for silver in a rigged market, then stop looking at the daily silver prices. However, if you are going to look at the daily silver prices, then all I am doing is providing short-term analysis on HOW THE TRADERS LOOK AT SILVER.
Do you understand that? With that in mind, I believe as the U.S. Government and China come up with a final trade deal, that could push the stock markets higher and the precious metals lower. Take it or leave it. But, again… that doesn’t change the fact that days of the Fed and central bank control of the financial system are coming to an end.
Lastly, it was an excellent sign to see silver finally break above the 50-month moving average. Furthermore, it isn’t unusual for silver to retrace the key level it broke through before the next leg higher. So, as we wait for the Fed and central banks to make a real mess of the financial system, we are just going to have to watch as silver trades in the current highly rigged market.