by gorillaz0e
Graph of this issue:
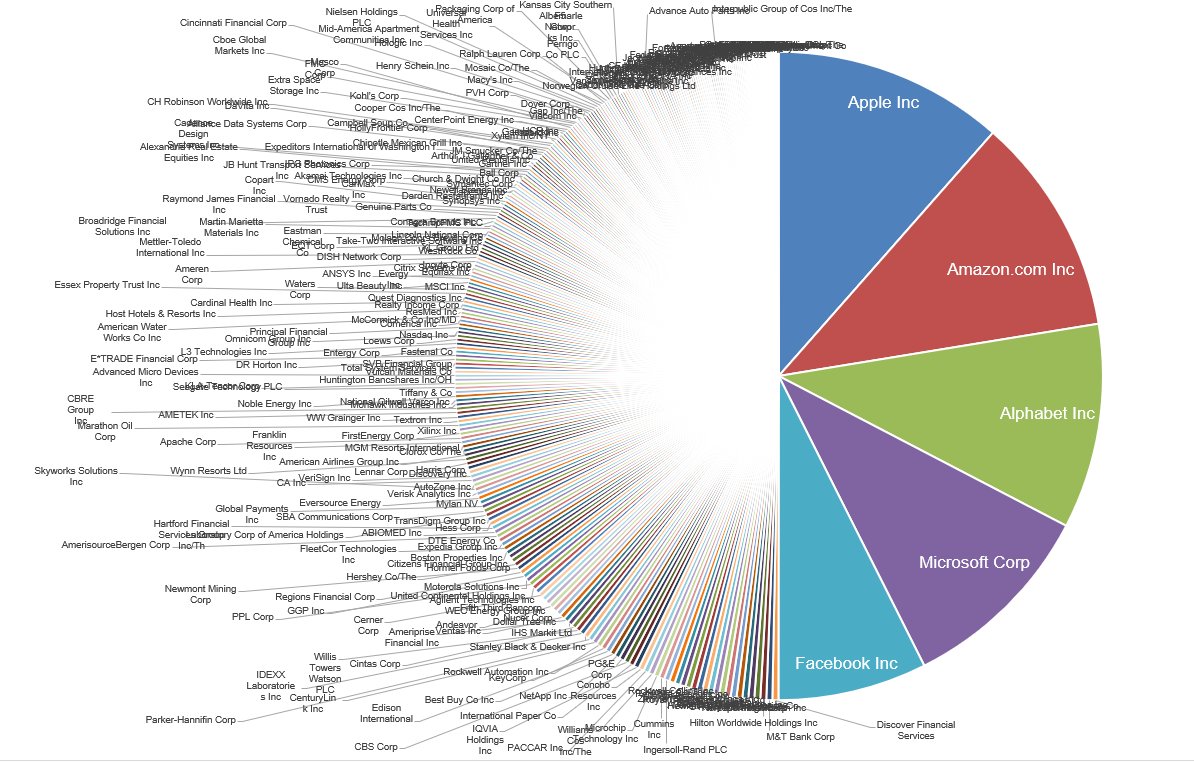
https://pbs.twimg.com/media/DicAwRmVsAAd97J.jpg
This chart shows that the five largest S&P 500 stocks have a market capitalization equal to the bottom 282 S&P 500 stocks. This turned out to be something of a Rorschach test, which was not my intention. I just thought it was a powerful visual. I wasn’t really trying to make a point, certainly not the point that many thought I was going for.
The reason I made that chart was because I was working on this post today, which will attempt to show that there are plenty of other stocks outside of FAANG that are doing just fine. That tweet had the opposite effect. Hopefully this will remedy that.
The chart below shows the average returns of S&P 500 stocks year-to-date broken down by market cap decile. The first decile is the 50 largest stocks, the second decile is the next 50 largest stocks, and so on. You can plainly see that while the mega caps are performing well, and powering the index higher, there are other stocks that are doing just fine. The 4th, 6th, and 7th deciles are performing better than the 2nd and 3rd.
It is pretty wild to think that the five largest stocks are as large as the bottom 282 S&P 500 stocks, but the truth is, this is how a cap weighted index works. Yum! Brands can triple and it still would not move the needle of the index as much as if Apple gains 1%.
We are not in uncharted territory. The Pareto Principle is a feature of financial markets, not a bug.
Do you think the largest S&P 500 stocks will continue to be equally big and dominant, in market cap, in the future?