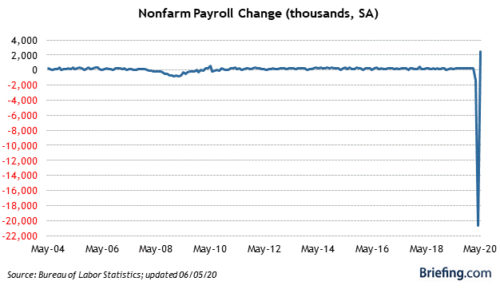
The first graph gives you a glimpse of the “huge jobs rebound” that shocked the stock market into spurting past its 200 DMA barriers because retail investors and algos aren’t looking past the headlines.
The second graph below shows you what a tiny difference that made to the total number of jobs that were lost:
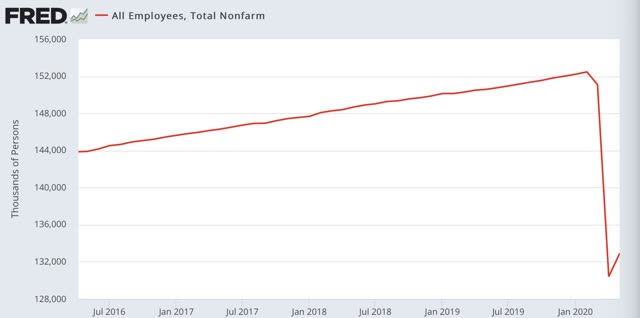
Some recovery, huh?
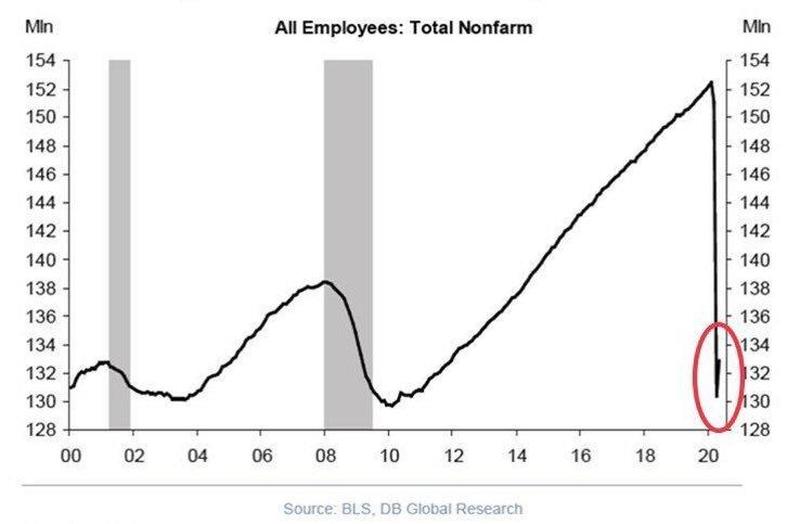
In broader context, that looks like this:
Why the dramatic difference?
The first graph is the number of jobs added or lost in a month. April saw a net loss of 20.5 million jobs (and that is a very conservative figure). May saw a net gain of 2.5 million. So the change one month was negative, and the change the next month positive. It looks, when graphed like that, to be a full recovery in a month, but it’s just a switch from a big plunge on the negative side of the graph to a small uptick in one step.
However, May’s gain is only 10% of what was lost even by these most conservative estimates, and May’s report included a large mistake:
As happened in April and March, some people who were not at work during the entire reference week for reasons related to the coronavirus … were misclassified as employed but not at work…. 5.4 million people were included in the “other reasons” category…. BLS analysis of the underlying data suggests that this group included workers affected by the pandemic response who should have been classified as unemployed on temporary layoff…. BLS and the Census Bureau are investigating why this misclassification error continues to occur and are making changes for the June collection….
If the workers who were recorded as employed but not at work for the entire survey reference week had been classified as “unemployed on temporary layoff,” the overall unemployment rate would have been higher than reported…. 4.9 million workers who were included in the “other reasons” category should have been classified as unemployed on temporary layoff. If these workers were instead considered unemployed on temporary layoff, the number of unemployed people in May (on a not seasonally adjusted basis) would increase by 4.9 million from 20.5 million to 25.4 million…. The resulting unemployment rate for May would be 16.1 percent (not seasonally adjusted), compared with the official estimate of 13.0 percent (not seasonally adjusted).
Oops.
[Note that “unemployment” is a different number than “total nonfarm payroll,” but BLS indicates this error affected the “total nonfarm payroll,” too.]
Moreover, May’s rehires benefited from the CARES Paycheck Protection Program that put people back on payroll, not so much from economic improvement.
In terms of total job recovery, we’ve clearly got a long way to go. June will take us up a lot more than May, but still nowhere near the top. After that, the graph will flatten out to a much slower rise, or it may fall if COVID-19 sticks its head up again, as it is likely to do. We won’t see the second graph get up to where it was all year and probably not all of next year, but we may see it start to slowly go back down toward the end of summer as the domino effect of the shutdown begins to show up in more business closures and the next tier of layoffs that may come for management in downsized businesses.
Here’s the amount of actual economic recovery:
The amount of economic recovery achieved for May, when Trump started opening up the economy, looks like this for the services sector:
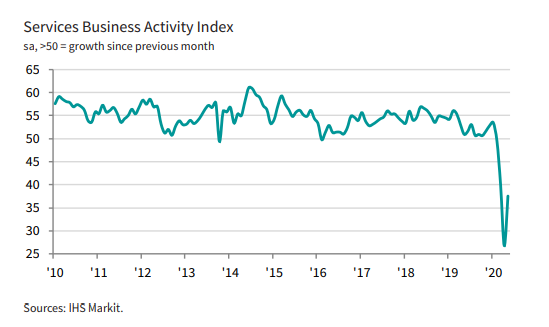
Less than half so far.
And like this for manufacturing:
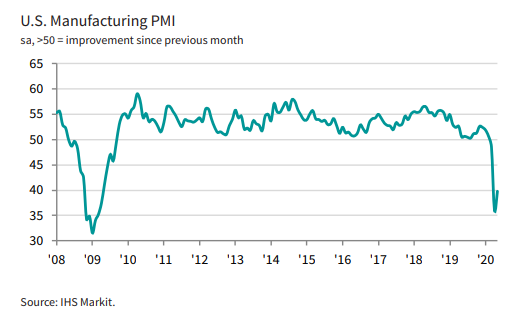
Less than a third.
Of course, many states are phasing in the reopening, but that is just one more reason it won’t be anything close to V-shaped, though it restarted with a nice minor V-shaped bounce, but you have to chop off nine-tenths of the first down leg of the “V” to make it look like a “V” and not a backward checkmark.
So, check that one off. Not happening.
Look around your local economy.
It’s anecdotal, but already around my area some local businesses have announced they won’t reopen ever. Some national businesses have also announced that for their local stores.
The local mall is set to reopen. It was already 10% boarded up before it closed for the Coronacrisis. I’ll bet within a month of the time it reopens, we now see it is 20% boarded up because some of those businesses that were still running before the Coronacrisis, were struggling just like those that had already closed. They won’t likely be reopening. And that will leave the mall profitless for the remainder of the year and probably longer.
There is no V-shaped recovery in the graphs above, and there won’t be after next month’s employment data for total jobs either. Mark my word. Checkmark it in honor of the backward-checkmark recovery so far.
Come back here and tell me all about it if my economic prediction is wrong: There will be NO V-shaped recovery for the economy. (And don’t mistake the stock market for the economy — a classic error — because the stock market is, after all, stupid.)