Wolf Richter wolfstreet.com, http://www.amazon.com/author/wolfrichter
New York condo prices fell again. Historic spikes slow in Seattle and other metros.
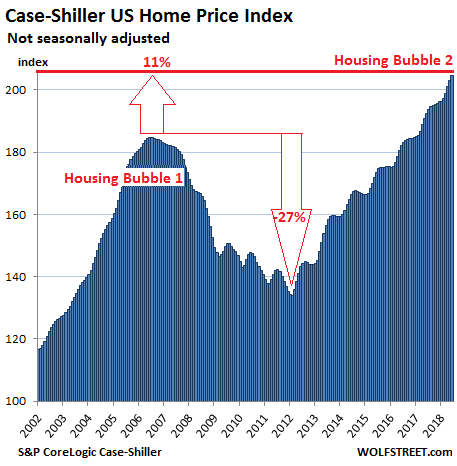
On a national basis, home prices surged 6.2% in June compared to June last year (not seasonally-adjusted), and 0.8% from May, according to the S&P CoreLogic Case-Shiller National Home Price Index released this morning. The index is now 11% above the July 2006 peak of “Housing Bubble 1” — the first housing bubble in this millennium. After its collapse, it was called a “bubble” and “unsustainable.” But by now, this peak of the collapsed bubble has been transformed into the new-normal rock-solid base of the current housing market. The index is now 53% above the bottom of “Housing Bust 1”:
There have been some indications that some local housing markets are experiencing deteriorating fundamentals: declining sales volume, rising inventories, less foot-traffic, increasing number of days on the market, etc. [here is an example], though prices are slow to react. These dynamics are not yet visible in the some of the bubbliest markets as depicted by the Case-Shiller Home Price index — except in the New York condos category where the index has dropped to the lowest level since October 2017.
The Case-Shiller Index is based on a rolling three-month average; today’s release is for April, May, and June. The index is based on “home price sales pairs,” comparing the sales price of a home in the current month to the last transaction of the same home years earlier. The index incorporates other factors and uses algorithms to arrive at each data point. It was set at 100 for January 2000; an index value of 200 means prices as figured by the index have doubled. It’s an alternative to median-price indices (half of the homes sell for more, and half sell for less).
The index is not inflation adjusted. It’s itself a measure of inflation: of asset price inflation, specifically of home-price inflation, where the dollar is losing purchasing power with regards to housing; in other words, it takes more dollars to buy the same home.
So here are the most splendid housing bubbles in major metro areas in the US:
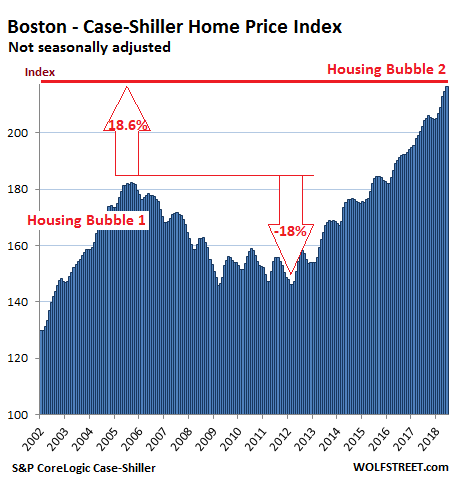
Boston:
The Case-Shiller Home Price Index for the Boston metro jumped 7.1% from a year ago. During Housing Bubble 1, from January 2000 to October 2005, the index soared 82% before dropping. It now tops that crazy peak by 18.6%:
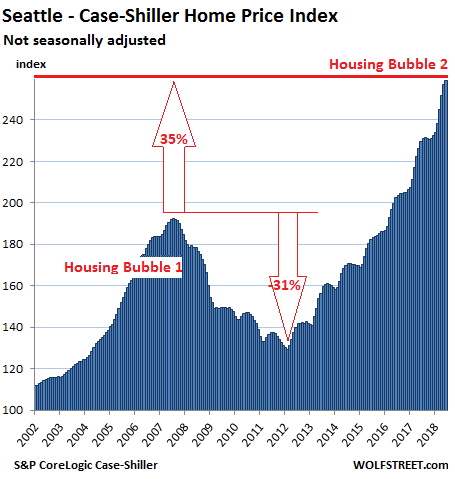
Seattle:
Home prices in the Seattle metro rose 0.7% in June from May. This is a slow-down from the historic spike in prior months. Over the past 12 months, the index has jumped 12.8%. It is 35% above the peak of Seattle’s crazy Housing Bubble 1 (July 2007):
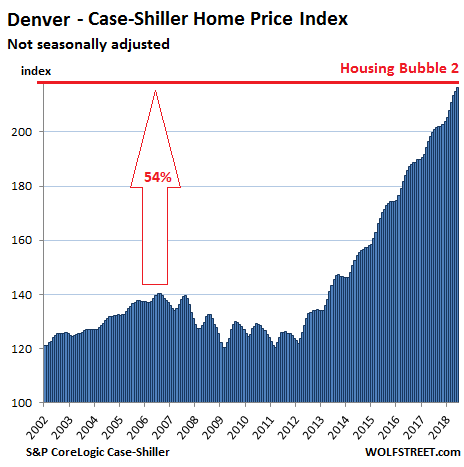
Denver:
The index for the Denver metro booked its 32nd monthly increase in a row in June, adding to the historic spike over the past few months. It’s up 8.3% from a year ago and 54% from the peak in July 2006:
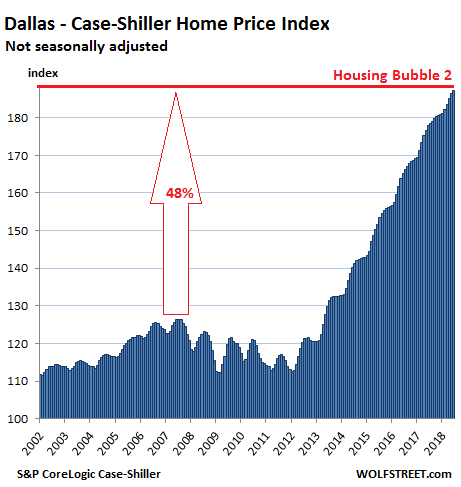
Dallas-Fort Worth:
The Case-Shiller index for for the Dallas-Fort Worth metro rose for the 53rd month in a row, and is up 5.2% from a year ago. Since its peak during Housing Bubble 1 in June 2007, the index has surged 48%:
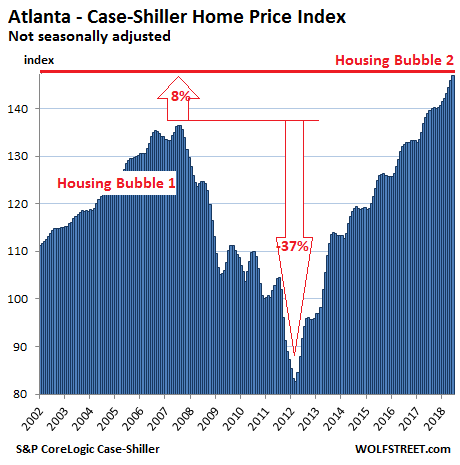
Atlanta:
Home prices in the Atlanta metro rose 0.7% in June from May, according to the Case-Shiller index, and 5.7% over the 12-month period. It now exceeds the peak of Housing Bubble 1 in July 2007 by 8%:
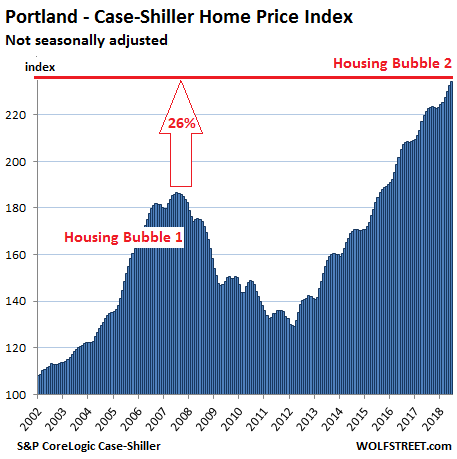
Portland:
Home prices in the Portland metro in June rose 0.7% from a month ago, 5.9% from a year earlier, and 26% from the crazy peak of Housing Bubble 1 in July 2007. It has ballooned 134% since 2000:
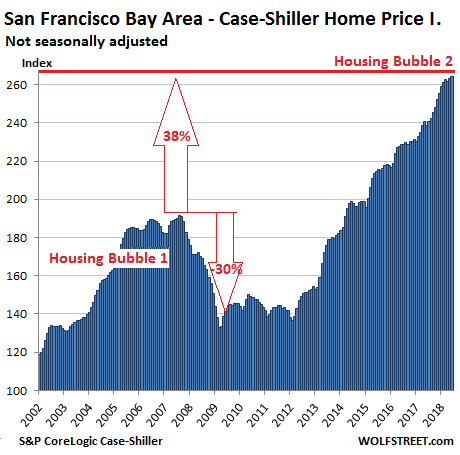
San Francisco Bay Area:
The index for “San Francisco” includes five counties: the city and county of San Francisco, the northern part of Silicon Valley (San Mateo County), part of the East Bay (counties of Alameda and Contra Costa), and part of the North Bay (Marin County). In June, the index rose 0.4% from the prior month and 11% from a year ago. It’s up 38% from the crazy peak of Housing Bubble 1 and up 164% since 2000:
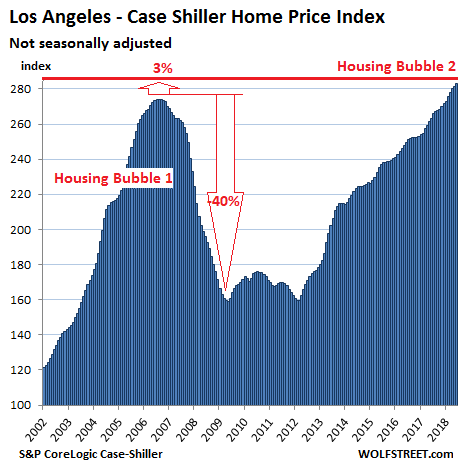
Los Angeles:
The Case-Shiller index for the Los Angeles metro in June rose 7.4% year-over-year. Between January 2000 and July 2006, the index had skyrocketed 174% before its epic collapse. The index now exceeds the complete nut-job of Housing Bubble 1 by 3%:
New York City Condos:
Prices for condos in the New York City metro fell — yes, fell — 1.6% from the prior month, the third month in a row of monthly declines, according to the Case-Shiller index for condos. The index is now down 2.2% from the peak in March and is up only 0.6% year-over-year and at the lowest level since October 2017:
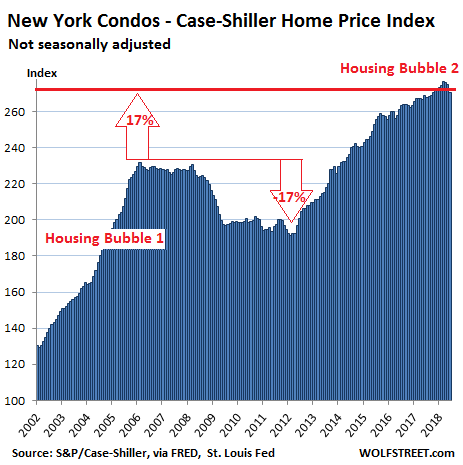
This dip in condo prices is either the first visible sign of a deflating housing bubble on this list of the most splendid housing bubbles in America, or it’s just a temporary dip. Once the index is down year-over-year — at this rate, in a month or two — it would establish a trend.
Real estate is local. But prices are also impacted by national and global factors, such as monetary policies and offshore investors for whom “housing” in the US is not only an asset class used for diversification, but also in many cases an exit route for their family and wealth away from their own governments. These factors combined inflate local housing bubbles. When enough local housing bubbles come together, they turn into a national housing bubble (see the first chart), though some other markets may lag behind or never get into a bubble status.
The first wave in the buy-to-rent scheme, where private equity firms buy hundreds of thousands of single-family houses in a small number of markets, got started during the housing bust. Now comes the second wave, by a different set of private-equity firms, at the peak of the market, as brokers constantly blame low inventories of single-family houses for sky-high prices. Read… Here Comes the 2nd Wave of Big Money in the “Buy-to-Rent” Scheme