
Wolf Richter wolfstreet.com, http://www.amazon.com/author/wolfrichter
Seattle house prices fall year-over-year. New York condos drop to Aug 2017 level. San Francisco Bay Area near-flat. Los Angeles, Denver, Boston reach new highs. Las Vegas, Phoenix dream of crazy Housing Bubble 1. Miami stalls
“Prices are cooling, and Western states are starting to see the dip,” said CoreLogic in a statement when it released its S&P CoreLogic Case-Shiller Home Price Index this morning. But prices are not cooling everywhere. So let’s see.
Seattle House Prices:
Prices of single-family houses in the Seattle metro ticked up 0.6% in June from May, according to the Case-Shiller Index. This was a much smaller increase than the seasonal increases in prior years. So, compared to June 2018, house prices fell 1.3%, the second year-over-year decline in a row, after May’s 1.2% year-over-year decline – and the first such event since Housing Bust 1:
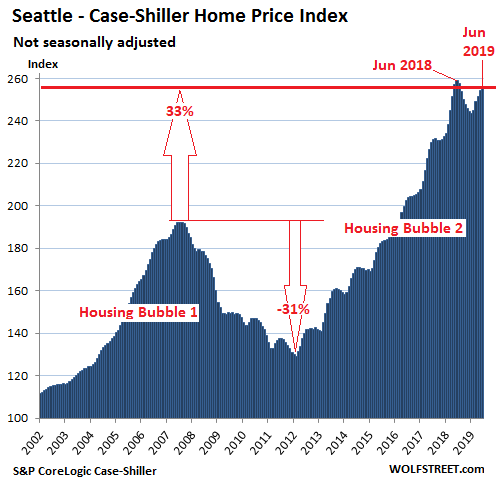
The Case-Shiller Index is a rolling three-month average. Today’s release represents closings that were entered into public records in April, May, and June. So the data roughly coincides with the peak of spring and early summer home buying season.
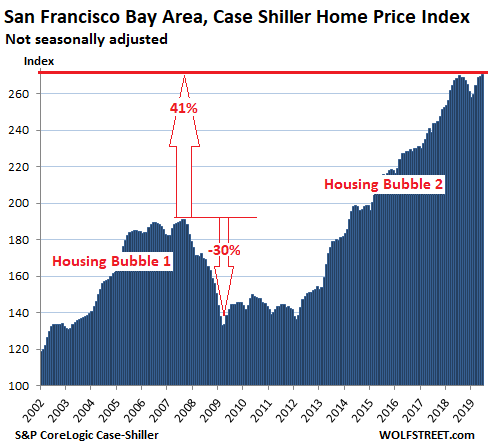
San Francisco Bay Area Single-Family House Prices
Single-family house prices in the five-county San Francisco Bay Area – the counties of San Francisco, San Mateo (northern part of Silicon Valley), Alameda and Contra Costa (East Bay), and Marin (North Bay) – inched up 0.3% in June from May, about half of last year’s seasonal increase in June. And it eroded the year-over-year price gains to just 0.8%:
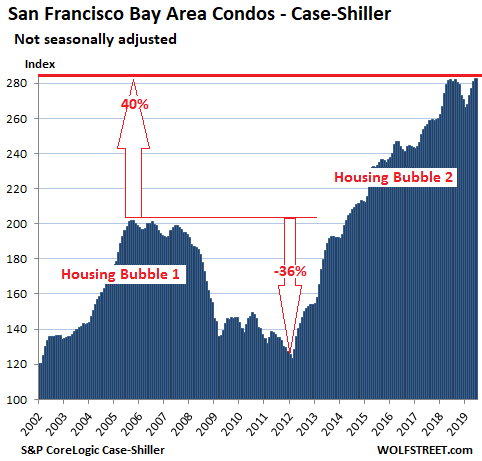
San Francisco Bay Area Condo Prices
In most of the 20 markets in the Case-Shiller series, the index covers only single-family houses. But in a handful of big markets where condos play are large role, it also covers condos. Condo prices in the five-county San Francisco Bay Area ticked up 0.6% in June from May and were flat compared to June 2018:
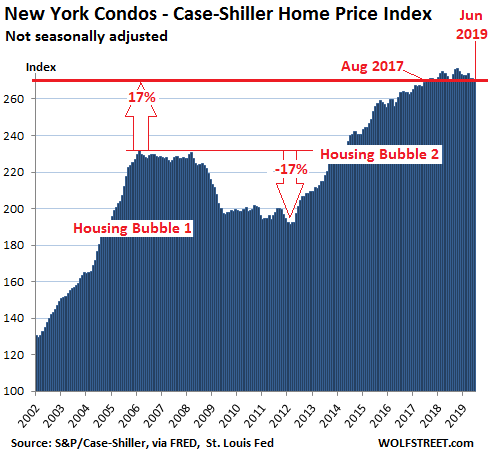
The Case-Shiller index was set at 100 for January 2000; an index value of 200 indicates prices have doubled since January 2000. Every housing market among these most splendid housing bubbles in America has or had an index value of over 200, either during Housing Bubble 2 or during Housing Bubble 1, which is the minimum requirement to make this list.
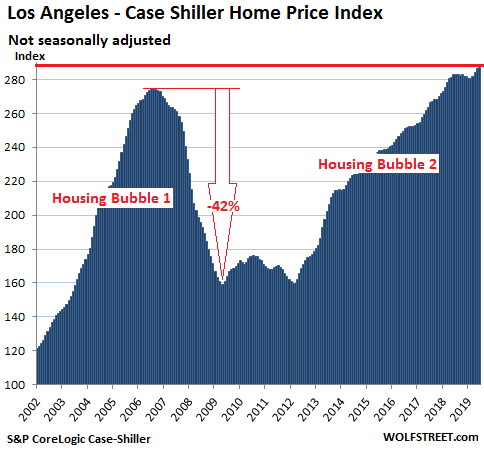
Los Angeles House Prices:
House prices in the Los Angeles metro edged up 0.2% in June from May, to a new record. This seasonal increase was comparatively small, and it whittled down the year-over-year increase to 1.6%:
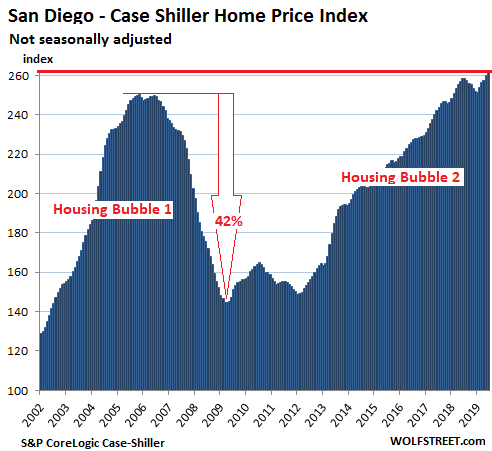
San Diego House Prices:
The Case-Shiller index for the San Diego metro rose 0.7% in June from May to a new record, which was only 1.3% higher than the prior record set in July 2018, and it was also up by 1.3% from June 2018:
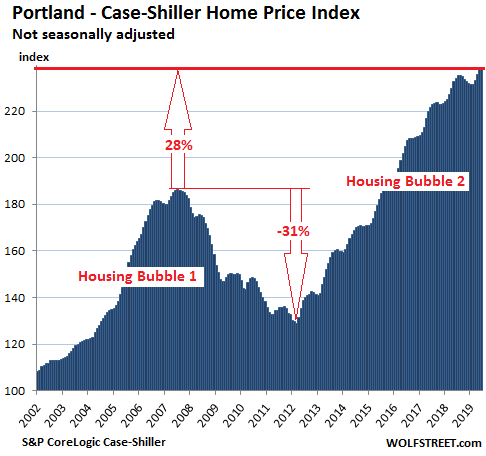
Portland House Prices:
In the Portland metro, house prices remained flat in June compared to May, and were up 1.7% from June 2018, the smallest year-over-year increase since May 2012:
The index as a measure of house price inflation:
The Case-Shiller Index (methodology) is based on “sales pairs,” comparing the sales price of a house in the current month to the last transaction of the same house, which may have been years ago. In other words, it tracks how many more dollars it takes to buy the same house over time. In this manner, the index tracks the purchasing power of the dollar with regards to houses in various markets. This makes it a measure of a specific type of inflation: “House-price inflation.”
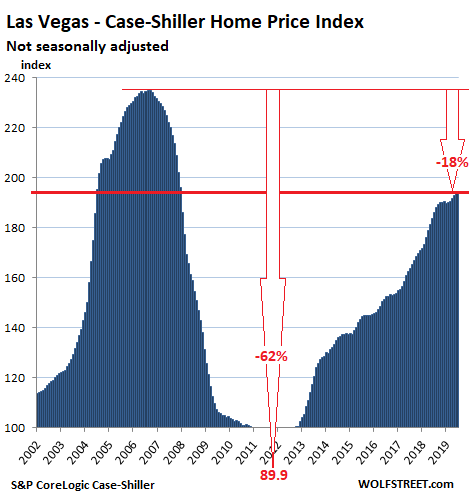
Las Vegas House Prices:
In the Las Vegas metro, house prices rose 0.5% in June from May, whittling down the year-over-year gain to 5.5%, from 6.4% in May. While the 5.5% gain is still out of whack, it was the smallest such gain since August 2016. There are not many markets in the US that embody crazy gambling in the housing market quite as well as Las Vegas (though below we’ll get to a couple of charts that are nearly as crazy):
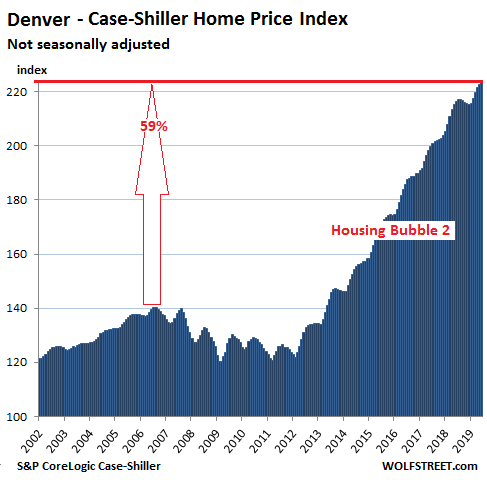
Denver House Prices:
In the Denver metro, house prices rose 0.4% in June from May, which whittled the year-over-year gain down further to 3.4%. While still a big-fat gain, it was the smallest year-over-year gain since April 2012:
New York Condo Prices:
The Case-Shiller index for condos in the New York City metro, instead of rising seasonally, fell in June compared to May. While the index is still up 0.4% from June 2018 (which had been a dip, as you can see in the chart), it is now down 2.2% from its peak in October 2018 and is back where it had first been in August 2017:
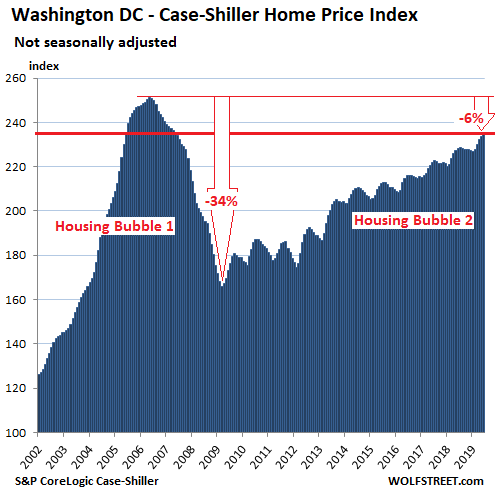
Washington DC:
In the Washington D.C. metro, house prices rose 0.5% in June from May, and were up 2.9% from June last year:
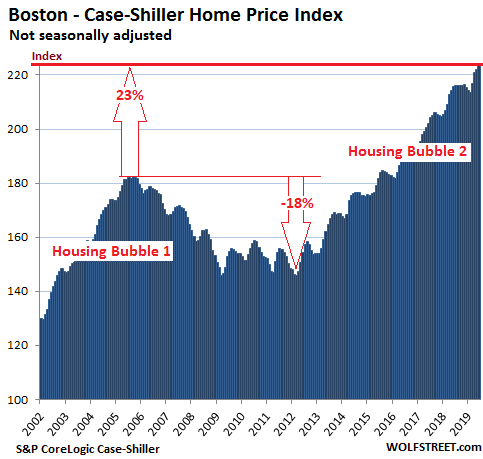
Boston House Prices:
House prices in the Boston metro rose 1.1% in June from May to a new record, and were up 3.9% year-over-year:
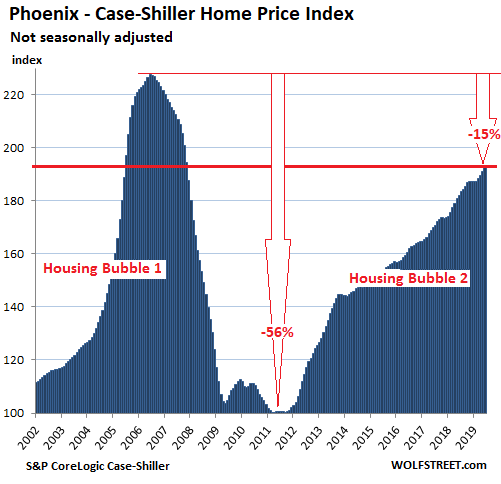
Phoenix House Prices:
House prices in the Phoenix metro rose 0.9% in June from May and were up 5.8% from June 2018. In terms of nuttiness, the Phoenix housing market – along with Miami and Tampa below – ranks near the top but can’t quite match the nuttiness of the Las Vegas market:
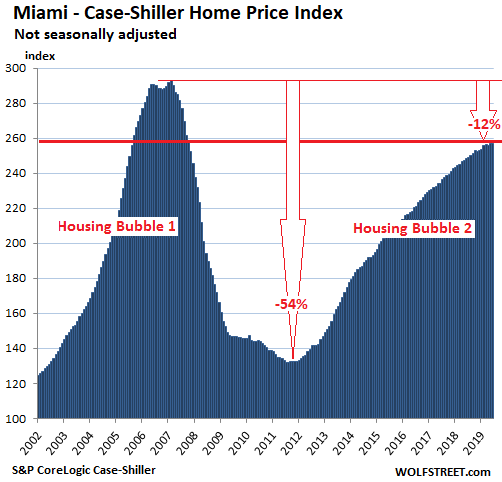
Miami House Prices:
In the Miami metro, house prices were flat in June compared to May, stalling efforts to catch up with the crazy peak of Housing Bubble 1. The stall reduced the year-over-year gain to 3.3%, the slowest such gain since May 2012:
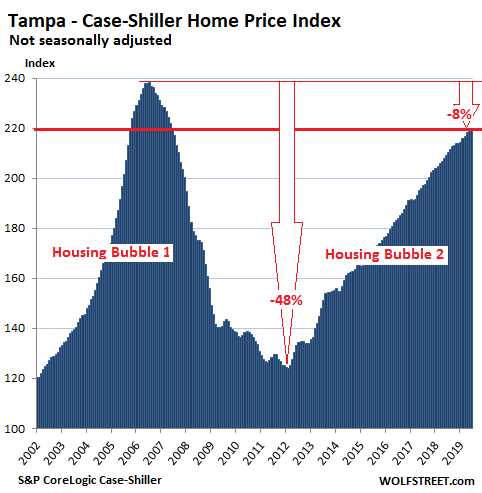
Tampa House Prices:
House prices in the Tampa metro inched up 0.2% in June from May, which whittled the year-over-year gain down to 4.7%. As big as this gain is, it’s the slowest such gain since August 2012:
Last time this happened was during the Financial Crisis. Now it’s happening in a kinder and gentler way, but there is no crisis. Read… Near-Record Low Mortgage Rates No Relief for Dropping New House Prices