Wolf Richter wolfstreet.com, http://www.amazon.com/author/wolfrichter
New York, San Francisco condo prices fall year-over-year. Seattle house prices flat year-over-year. After earlier declines, Denver, Boston hit new highs. Miami, Phoenix, Las Vegas try to regain nutty peaks of Housing Bubble 1.
Seasonal price spikes are cropping up in many of the most splendid housing bubbles in America, but in some metros they were not nearly large enough and prices fell compared to the same month last year, the first such declines since Housing Bust 1, and in others, they produced new all-time highs, and in others got them closer to the crazy highs of Housing Bubble 1.
New York Condo Prices:
In the New York City metro, condo prices dropped 0.8% in April from March, according to the CoreLogic Case-Shiller Home Price Index released this morning. This drop pushed the index down 1.8% from the peak in October 2018, and a tad (0.7%) below where it had been in April 2018, the first year-over-year decline since the end of Housing Bust 1. The index is now below where it had first been in January 2018:
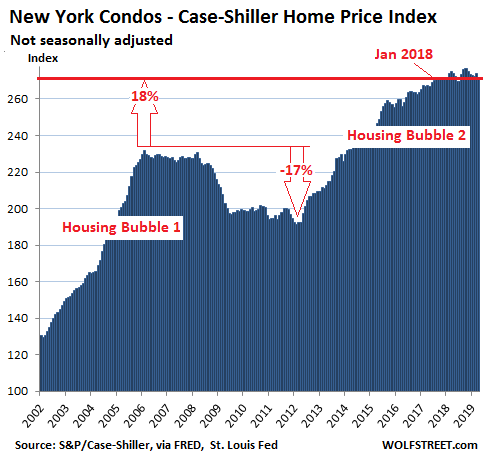
The Core-Logic Case-Shiller Home Price Index is a rolling three-month average; today’s release represents closings that were entered into public records in February, March, and April.
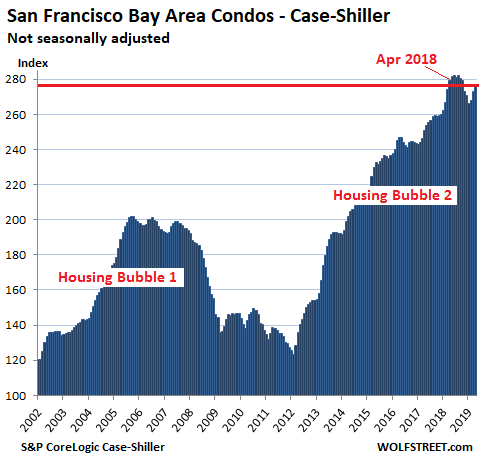
San Francisco Bay Area Condo Prices
Condo prices in the five-county San Francisco Bay Area – the counties of San Francisco, San Mateo (northern part of Silicon Valley), Alameda and Contra Costa (East Bay), and Marin (North Bay) – jumped 1.5% in April from March, according to the Case-Shiller index. But it wasn’t enough to beat the seasonal surge last year, and compared to April 2018, the index declined 0.7%. This was the second month in a row of year-over-year declines – the first such event since April 2012 at the end of Housing Bust 1:
San Francisco Bay Area House Prices
The Case-Shiller index for single-family house prices in the five-county San Francisco Bay Area jumped 1.6% in April from March. But it wasn’t enough and further eroded the year-over-year price gains, which are now down to just 1.8% compared to April 2018. The index remains below its peak of July 2018:
The Case Shiller index was set at 100 for January 2000; a value of 200 indicates that prices have doubled since January 2000. Every housing market on this list of the most splendid housing bubbles in America has an index value somewhere in its history of over 200, either during Housing Bubble 1 or during Housing Bubble 2, the minimum requirement for this list.
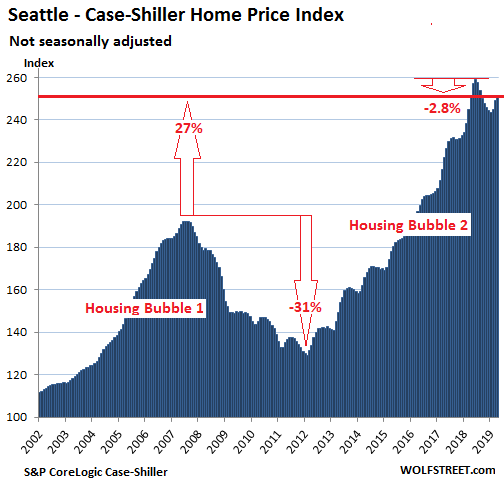
Seattle House Prices:
Prices of single-family houses in the Seattle metro rose 1.1% in April from March. But it wasn’t enough to keep up with the seasonal spring surge last year. This left the index flat with April 2018, the first year-over-year flat-reading since the end of Housing Bust 1 in April 2012. The index is down 2.8% from the peak in June 2018:
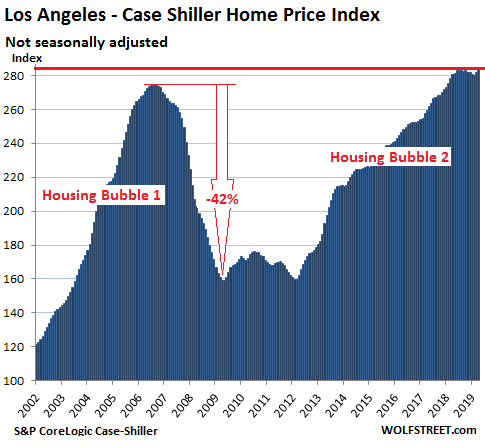
Los Angeles House Prices:
House prices in the Los Angeles metro rose 1.0% in April from March, thus beating by a tiny fraction the old record of August 2018, according to the Case-Shiller index. This moved the index up 1.5% from April 2018:
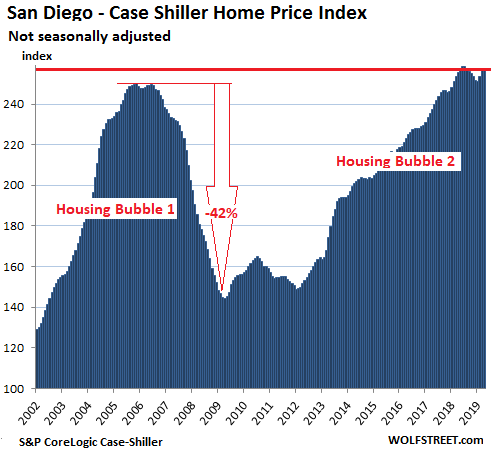
San Diego House Prices:
House prices in the San Diego metro ticked up 0.5% in April from March, less than the seasonal jump a year ago, which eroded the year-over-year gain further, now down to just 0.8% compared to April 2018. The index remained down a smidgen from its peak in July last year:
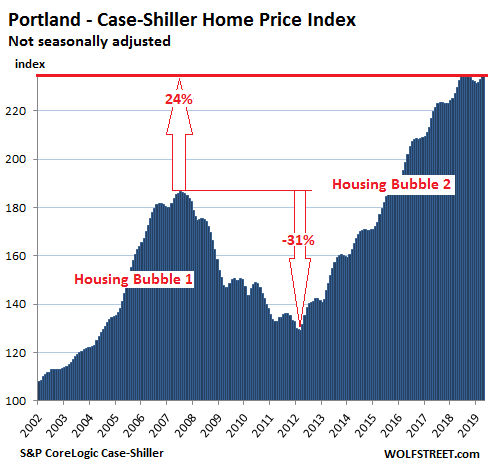
Portland House Prices:
The Case Shiller index for house prices in the Portland metro rose 1.1% in April from March, in line with the seasonal jump last year, leaving the year-over-year gain at 2.6%, but it allowed the index to barely squeak past its record of July 2018 to a new record by the thinnest of margins — and has the chart shows, has been essentially flat since July last year:
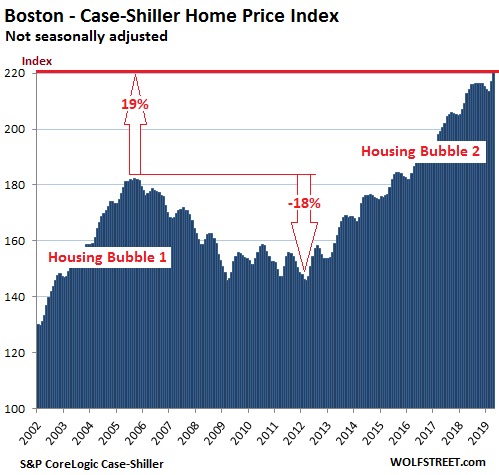
Boston House Prices:
After declining three months in a row from their November peak, house prices in the Boston metro started rising again in March, in line with seasonal moves. In April, the Case Shiller index jumped 1.9% from March to a new high, for a year-over-year gain of 3.9%:
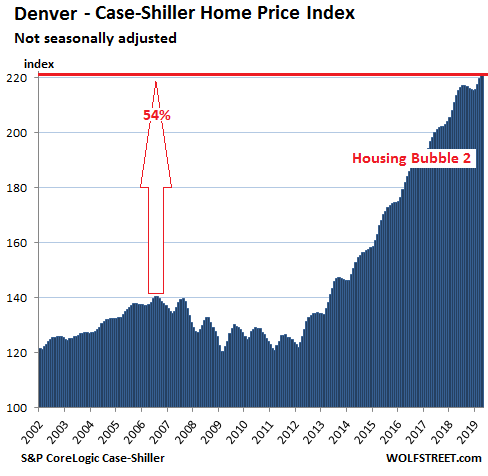
Denver House Prices:
House prices in the Denver metro rose 0.8% in April from March, but the seasonal gain was smaller than last year, and the year-over-year gain of the Case Shiller index was whittled down to 3.8%, the smallest gain since May 2012:
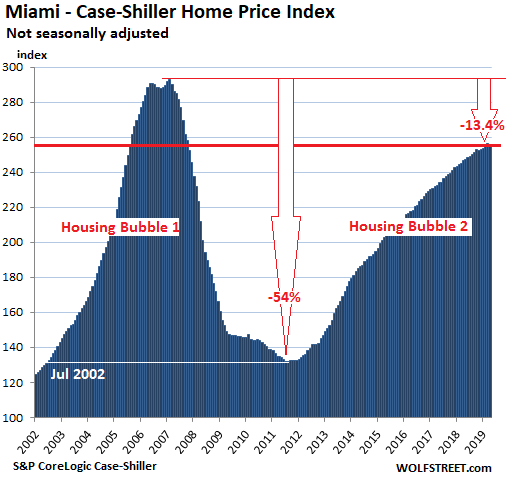
Miami House Prices:
House prices in the Miami metro in April ticked up a smidgen from March but remained a smidgen below February, creating a three-month flat spot that has now whittled the year-over-year gain down to 3.7%. This leaves the index 13.4% below the nutty peak of Housing Bubble 1:
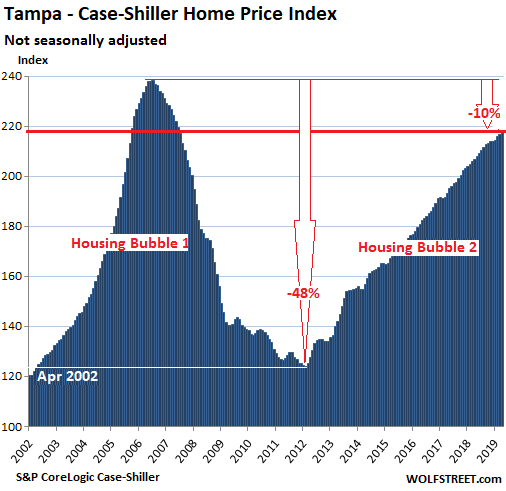
Tampa House Prices:
House prices in Tampa rose 0.7% in April from March and are up 5.6% year-over-year, but remain down 10% from their mind-bendingly nutty peak during Housing Bubble 1:
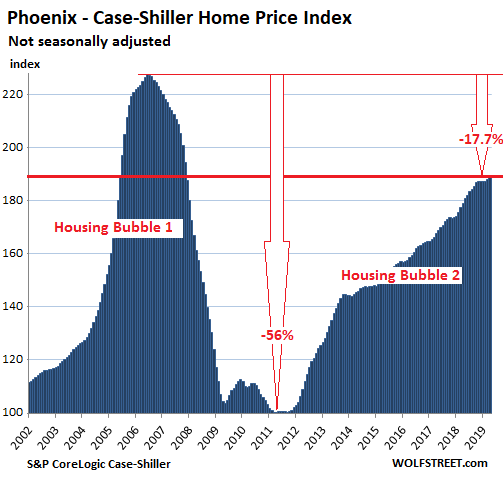
Phoenix House Prices:
The Case Shiller index for the Phoenix metro rose 0.8% in April from March, for a year-over-year again of 6.0%, leaving the index 17.7% from its crazy peak during Housing Bubble 1:
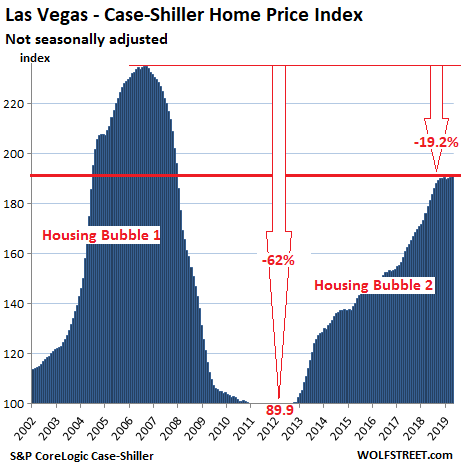
Las Vegas House Prices:
House prices in the Las Vegas metro rose 0.6% in April from March, for a 7.1% year-over-year gain, but that was down from February’s 9.7% and March’s 8.2% year-over-year gain. The index has been essentially flat since October last year:
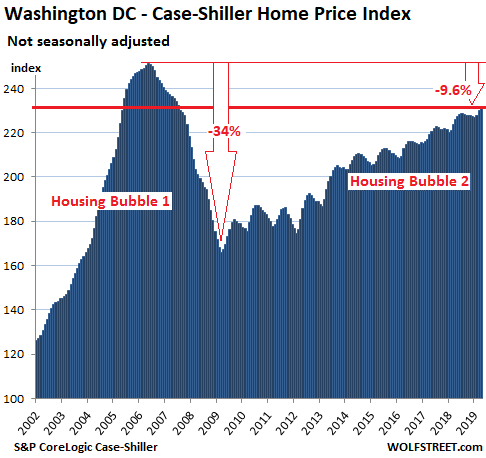
Washington DC:
The Case Shiller index for the Washington D.C. metro rose 0.9% in April from March, but this gain was less than the seasonal gain last year, and the year-over-year gain was whittled down to 2.6%. The index remains 9.6% below its nutty peak of Housing Bubble 1:
The Case Shiller Index, a measure of house price inflation
The Case-Shiller methodology is based on “sales pairs”: It compares the sales price of a house in the current month to the last transaction of the same house years ago, thus tracking price changes of the same house over time. When the price of a house doubles, it’s not because the house grew to be twice its former size, but because it takes twice as many dollars to buy the same house. So the index tracks the purchasing power of the dollar with regards to the same house, which makes it an effective measure of house-price inflation.