
Prices in New York City condo market, San Francisco Bay Area, Seattle down to early 2018 levels. Chicago nearly flat from year ago. Other markets rise. Phoenix, Tampa, Charlotte surge.
By Wolf Richter for WOLF STREET.
Reports have been circulating for a while about the deterioration in the Manhattan housing market, including a report in December that studied condo towers with 30 or more units, built after 2015, in total 7,727 condos, nearly half of which the developers have been unable to sell. Much of the new inventory is at the luxury end.
The median price of luxury condos and co-ops in Manhattan (median means half of the units sold for more, and half sold for less) in Q4 2019 plunged 24% from Q4 2018, to $4.8 million, according to the Elliman Report, and is down 27% from Q4 2016, which was the peak. The median price of all condos and coops in Manhattan in Q4, at $999,000, was flat compared to Q4 2018, but was down 6% from Q4 2017.
So today, the S&P CoreLogic Case-Shiller Home Price Index was released. The way the index is structured, it is much kinder and gentler, and far less volatile, than median price indices. For the New York metro, it offers two indices, one for single-family houses and one for condos. It uses a custom area for New York City that includes numerous counties in the states of New York, New Jersey, and Connecticut “with significant populations that commonly commute to New York City for employment purposes.” This is far larger and more diverse than Manhattan. Condo prices in the metro fell 0.9% in November from a year earlier, below where they’d first been in February 2018:
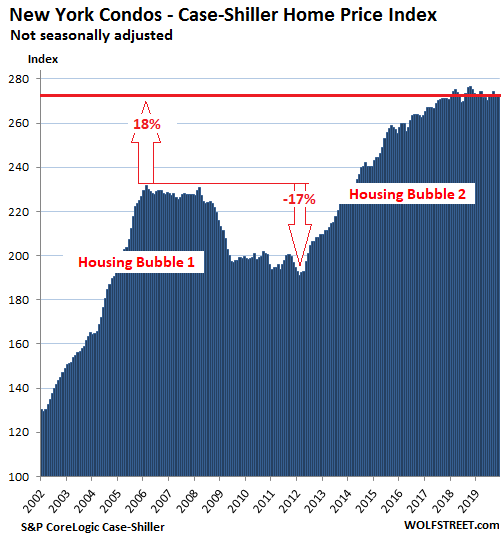
The Case-Shiller Index is a rolling three-month average. Today’s release includes closings that were entered into public records in September, October, and November. The index was set at 100 for January 2000. The New York condo index value of 273 means prices have soared 173% since January 2000.
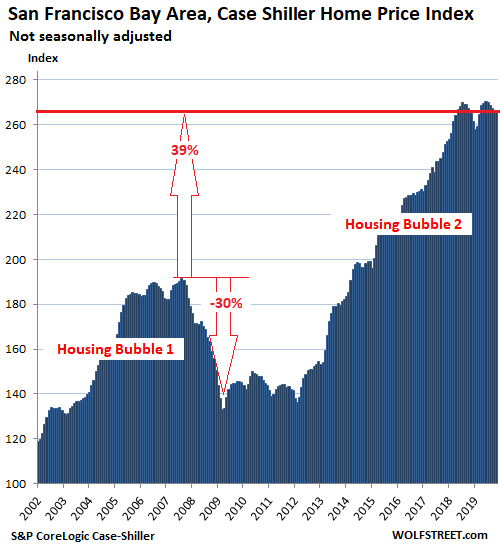
San Francisco Bay Area House Prices
The Case-Shiller Index for single-family houses in the five-county San Francisco Bay Area – the counties of San Francisco, San Mateo (northern part of Silicon Valley), Alameda and Contra Costa (East Bay), and Marin (North Bay) – ticked up 0.2% in November from October and was up 0.5% year-over-year, but was below where it had first been in May 2018. Note the double peak:
All charts here are on the same scale, with the vertical axis ranging from 100 to 290. This has the visual effect that there is more white space above the curve in markets where prices have soared less than they have in Manhattan, Los Angeles, San Francisco, Seattle, or Miami. From these charts it’s also clear that there is no “national” housing market but that all markets are local, each with its own dynamics; but that all of them are also subject to national dynamics, such as the Fed’s loosey-goosey monetary policies.
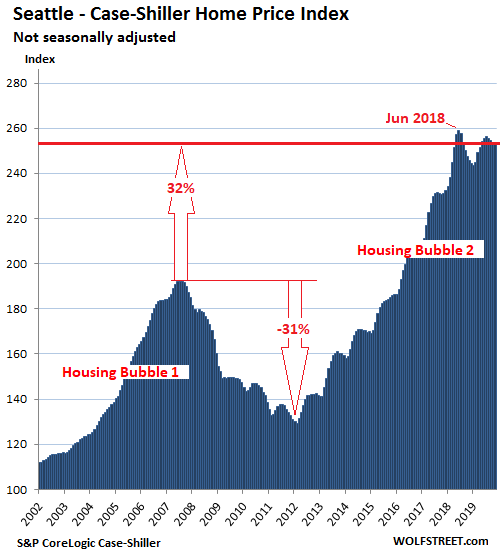
Seattle House Prices:
House prices in the Seattle metro were unchanged in November from October, and where down 2.0% from the peak in June 2018. This put them below where they’d first been in May 2018. Note the double peak:
The Case-Shiller Index methodology is based on “sales pairs,” comparing the sales price of a house that sold in the current month to the price of the samehouse when it sold previously. This method dodges some of the problems other indices have: Median-price indices can be skewed by “mix”; and average-price indices can be skewed by a few big outliers.
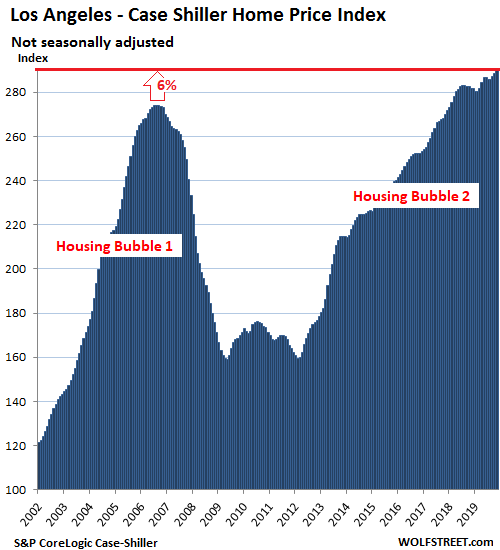
Los Angeles House Prices:
House prices in the Los Angeles metro rose 0.3% in November from October to a new record and were up 2.7% year-over-year. Los Angeles is now the market in the 20-city Case-Shiller Index where house prices have risen the most – by a dizzying 189% – since January 2000:
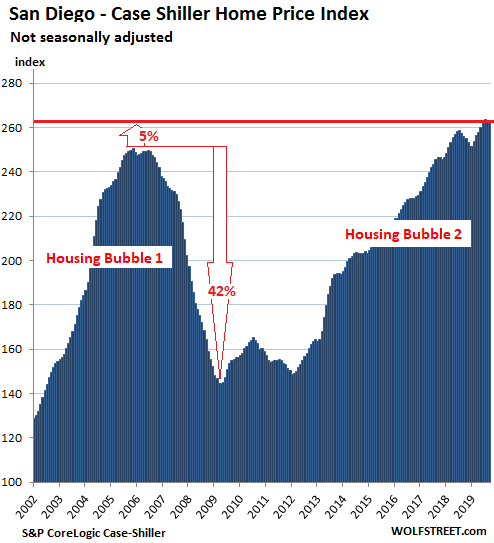
San Diego House Prices:
In the San Diego metro, house prices ticked up 0.3% in November from October, and are up 3.9% year-over-year, but remained a tad below where they’d been in July 2019:
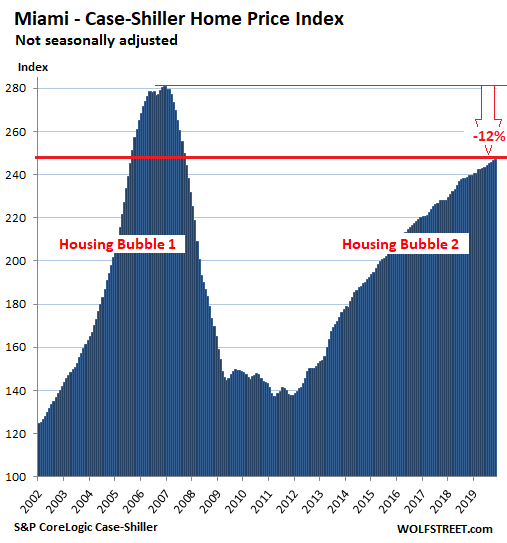
Miami House Prices:
House prices in the Miami metro rose 0.2% in November from October and 3.1% year-over-year. The index remains down 12% from the splendid insanity at the end of 2006 but is trying hard to get back to those levels. I want to emphasize that these are single-family-house prices in the vast Miami metro, and not condo prices, particularly the higher end near the waterfront, where Manhattan-like dynamics are playing out.
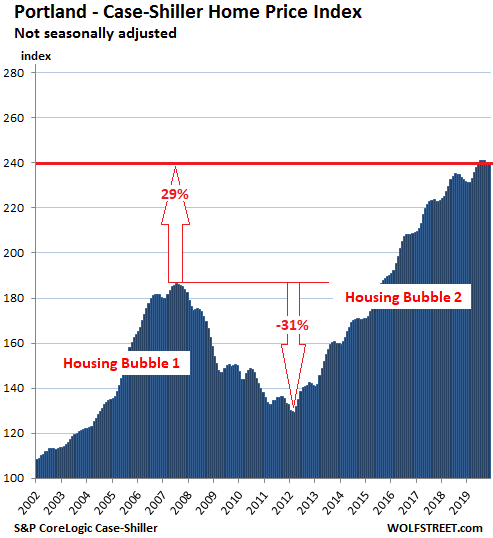
Portland House Prices:
The Case-Shiller index for the Portland metro was about flat in November compared to October and was up 3.3% year-over-year. At 240, the index is up 140% from January 2000:
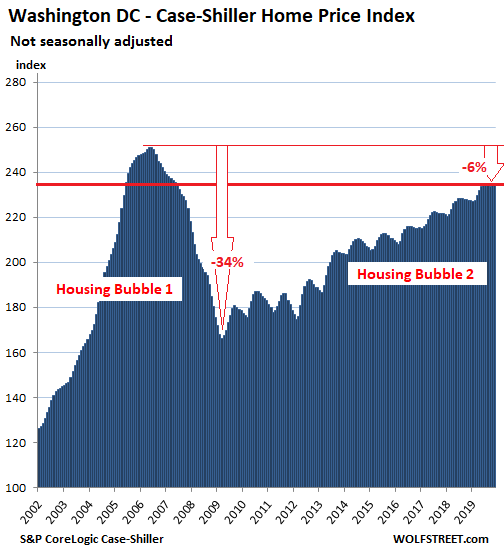
Washington DC:
House prices in the Washington D.C. metro ticked up 0.2% in November from October and were up 3.2% year-over-year:
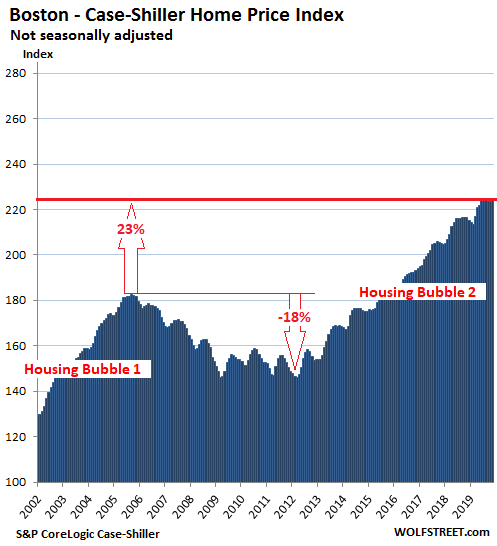
Boston House Prices:
House prices in the Boston metro rose 0.5% in November from October. Year-over-year, prices rose 3.8%:
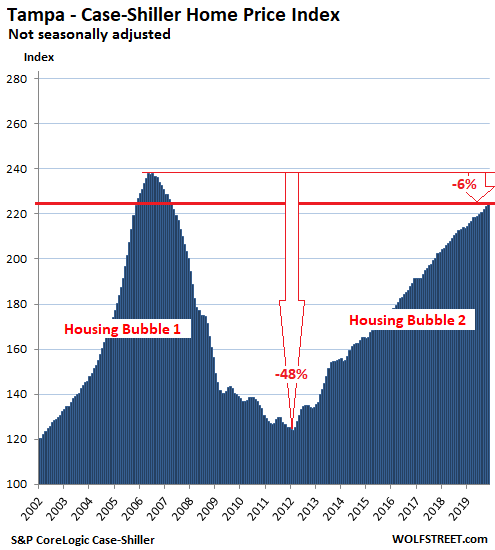
Tampa House Prices:
House prices in the Tampa metro rose 0.5% in November from October and were up 5.0% year-over-year, the third-largest year-over-year increase of the metros in the 20-City index, behind Phoenix (+5.9%) and Charlotte (+5.2%). The index is closing in on the craziness in 2006:
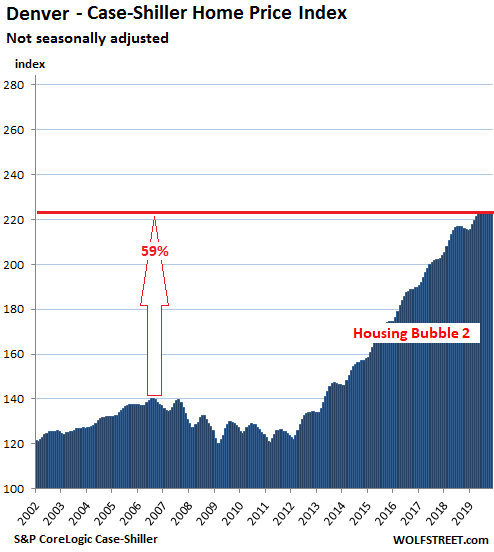
Denver House Prices:
House prices in the Denver metro were flat in November compared to October, and were flat for the past six months, but were still up 3.7% year-over-year:
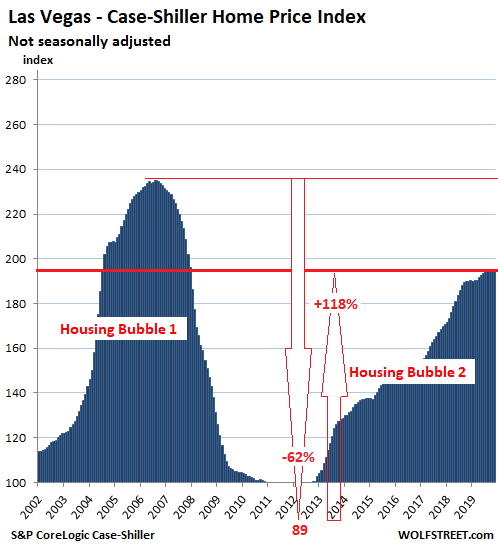
Las Vegas House Prices:
House prices in the Las Vegas metro rose 0.4% in November from October and gained 2.6% year-over-year, but for the past five months remained roughly flat:
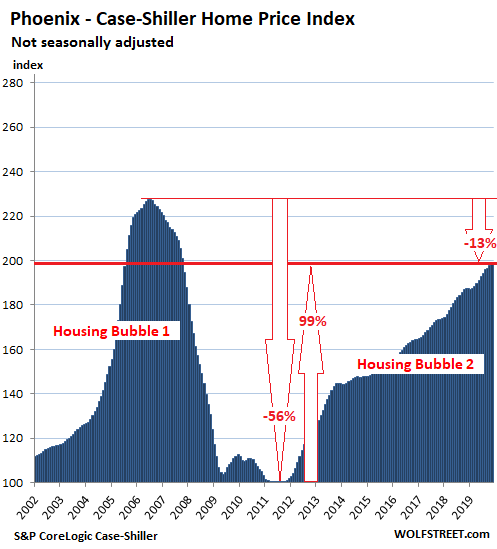
Phoenix House Prices:
The Case-Shiller index for the Phoenix metro rose 0.4% in November from October and was up 5.9% from November last year, the fastest year-over-year growth among the metros in the 20-City Index. And it’s fast approaching the crazy level of 2006, having almost doubled since September 2011:
Dallas-Fort Worth House Prices:
In the Dallas-Fort Worth metro – the counties of Collin, Dallas, Delta, Denton, Ellis, Hunt, Johnson, Kaufman, Parker, Rockwall, Tarrant, and Wise – house prices ticked up 0.2% in November from October, to a new record, and are up 2.8% year-over-year:

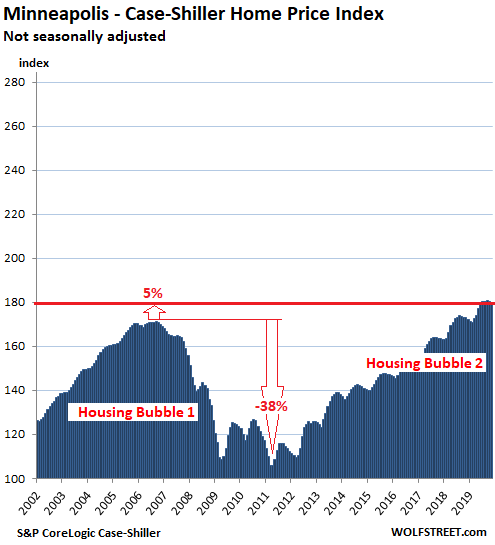
Minneapolis house prices:
House prices in the Minneapolis metro fell 0.5% in November from October and were up 3.9% year-over-year:
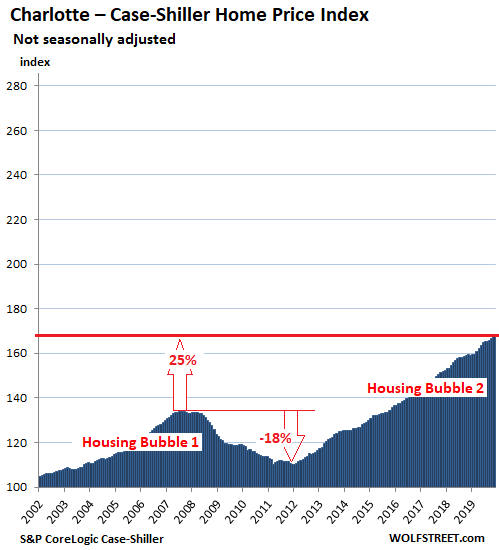
Charlotte house prices:
The Case-Shiller Index for the Charlotte metro rose 0.6% in November from October, and 5.2% year-over-year, the second-biggest year-over-year gain in the 20-City Index, behind Phoenix:
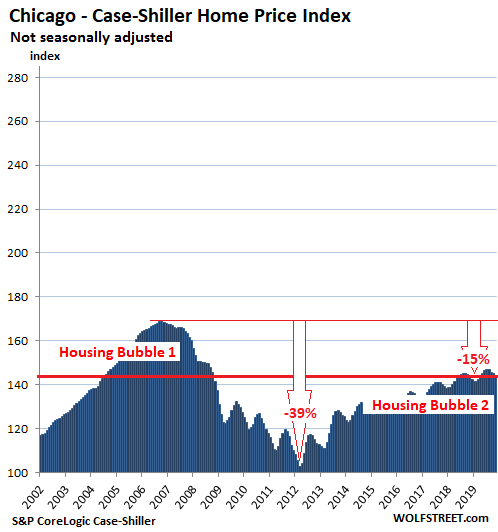
Chicago House Prices:
House prices in the Chicago metro – the counties of Cook, DeKalb, Du Page, Grundy, Kane, Kendal, McHenry, and Will – fell 0.6% in November from October, whittling down the year-over-year gain to just 0.4%:
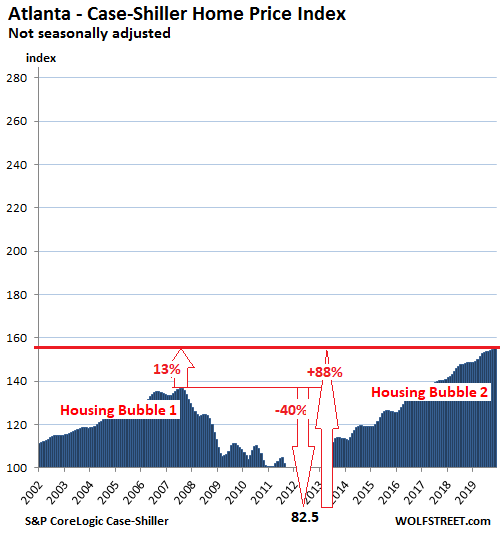
Atlanta house prices:
House prices in the Atlanta metro ticked up 0.2% in November from October and rose 4.2% year-over-year. During Housing Bust 1, the index had plunged 40% to an index value of 82.5 in March 2012, back where it had been in 1996. But since then, it has surged 88%:
What are we looking at here? House price inflation.
The Case-Shiller Index compares the sales price of a house in the current month to the price of the same house when it sold previously. In other words, it tracks how many dollars it takes over time to buy the same house. The house doesn’t change much, it just gets older. What changes is the purchasing power of the dollar with regards to houses. This makes the Case-Shiller index a measure of “house-price inflation”: When house prices shoot up, it means the dollar is more rapidly losing its purchasing power with regards to houses. And when house prices fall, it means that the dollar is gaining purchasing power with regards to houses.