Wolf Richter wolfstreet.com, http://www.amazon.com/author/wolfrichter
New York condo prices flat year-over-year. San Francisco, SoCal, Seattle year-over-year gains shrink to near nothing. Las Vegas flat for sixth month. Miami & Phoenix at post-Housing Bust 1 highs.
Spring has come to the most splendid housing bubbles in America, but the seasonal upticks weren’t enough, compared to the seasonal jumps last year at this time. And year-over-year price gains narrowed further.
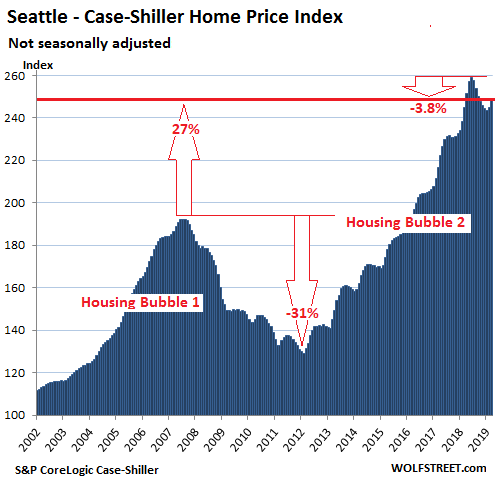
In the Seattle metro, prices of single-family houses rose 1.6% in March from February, according to the CoreLogic Case-Shiller Home Price Index released this morning. But in March last year, they’d soared 2.8% from February; so year-over-year, price gains narrowed further, with the index being merely 1.6% higher than in March last year, the smallest year-over-year gain since May 2012 when Seattle was emerging from the bottom of Housing Bust 1. The index is down 3.8% from the peak in June 2018 but is still up 27% from the peak of Seattle’s Housing Bubble 1 (July 2007):
The Core-Logic Case-Shiller Home Price Index is a rolling three-month average; today’s release represents closings that were entered into public records in January, February, and March.
The index was set at 100 for January 2000; a value of 200 now means prices have doubled since January 2000. Every market on this list of the most splendid housing bubbles in America has an index value of over 200, meaning that prices have more than doubled since January 2000. Having reached a value of at least 200 either during Housing Bubble 1 or during Housing Bubble 2 is the minimum requirement to be inducted into this list.
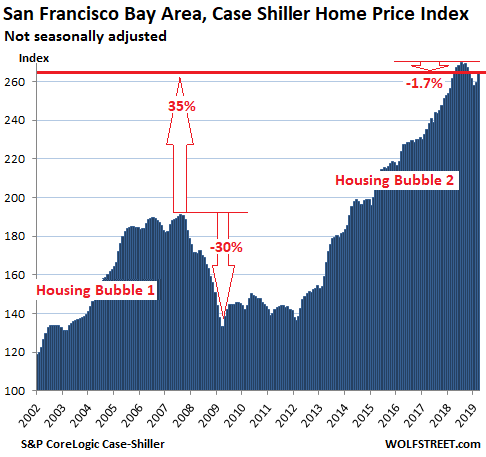
San Francisco Bay Area
In the five-county San Francisco Bay Area – the counties of San Francisco, San Mateo (northern part of Silicon Valley), Alameda, Contra Costa (East Bay), and Marin (North Bay) – prices of single-family houses rose 2.1% in March from February, same increase as last year from in March from February.
This leaves the index down 1.7% from its peak last July. And the year-over-year gain was merely 1.3%. The index remains 35% above the peak of Housing Bubble 1:
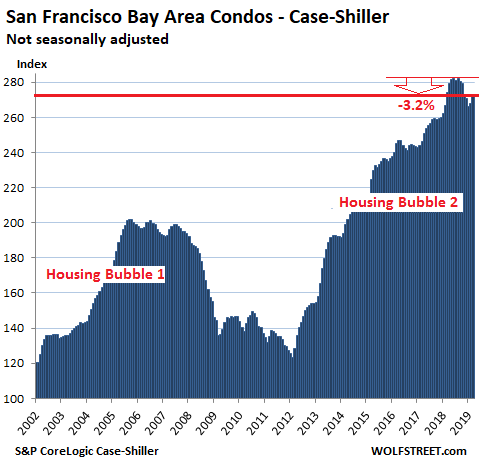
The Case-Shiller index for condos in the San Francisco Bay Area rose 2.0% in March from February. But last year in March, they’d risen 2.7% from February. This has whittled down the year-over-year gain to nearly nothing (+0.39%). The index is down 3.2% from the peak last June:
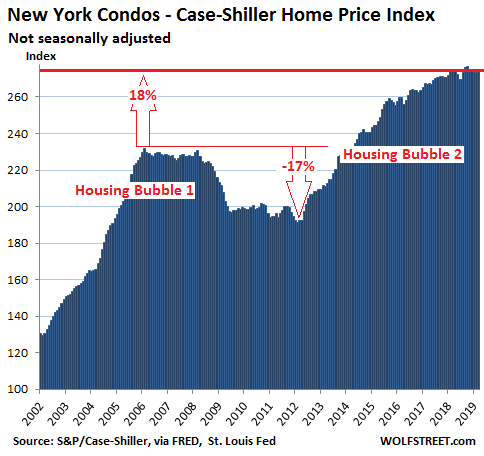
New York Condos:
The Case-Shiller index for condo prices in the New York City metro rose 0.7% in March from February and are flat with March last year, with zero price gains over the 12-month period. The index is down a smidgen from the peak in October:
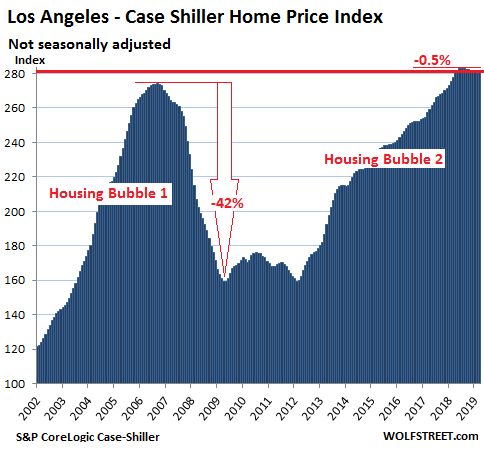
Los Angeles:
In the Los Angeles metro, house prices ticked up 0.5% in March from February. But the seasonal uptick in March last year had been 0.9%. And so the year-over-year gain shriveled further to just 1.3%. The index is now down 0.5% from the peak in August last year:
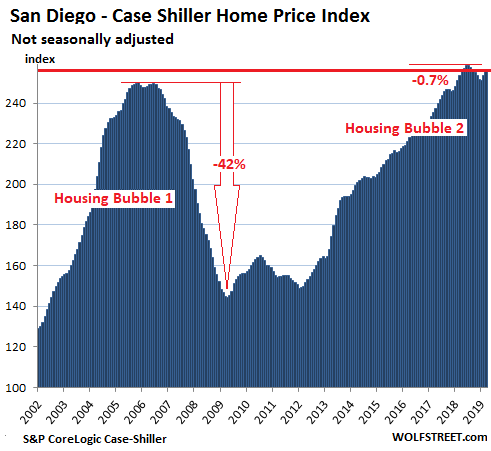
San Diego:
The Case-Shiller index for the San Diego metro rose 1.0% in March from February and is down 0.7% from the peak last July. Compared to March 2018, the index is up merely 1.3%.
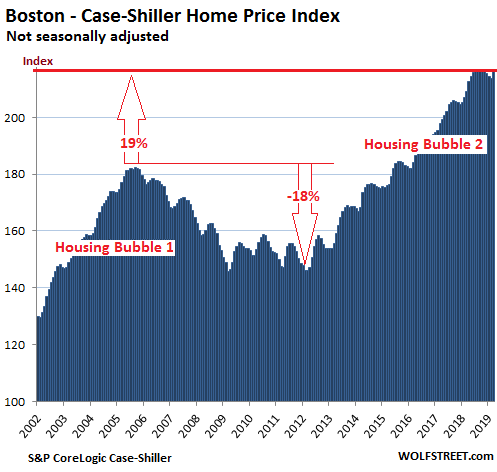
Boston:
The Case-Shiller index for the Boston metro jumped 1.6% in March from February, after having ticked down three months in a row, and eked out a new high by a tiny margin. This put the year-over-year gain at 3.8%. The index has been essentially flat since July 2016:
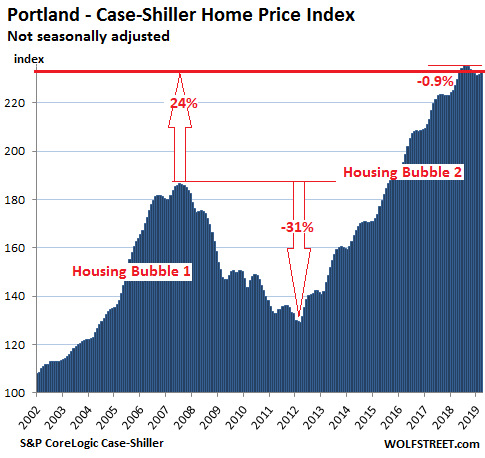
Portland:
House prices in the Portland metro ticked up 0.7% in March from February. But that seasonal gain was half the 1.4% gain in March last year. This whittled down further the year-over-year price gain to just 2.6%. The index is down 0.9% from the peak in July 2018:
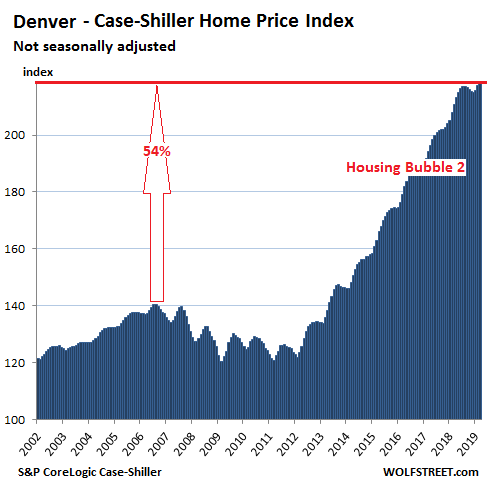
Denver:
House prices in the Denver metro rose 1.0% in March from February. But that seasonal gain was less than the seasonal gain in March last year (+1.4%), and the year-over-year gain in the index dwindled further to 4.3%, the smallest such gain since June 2012:
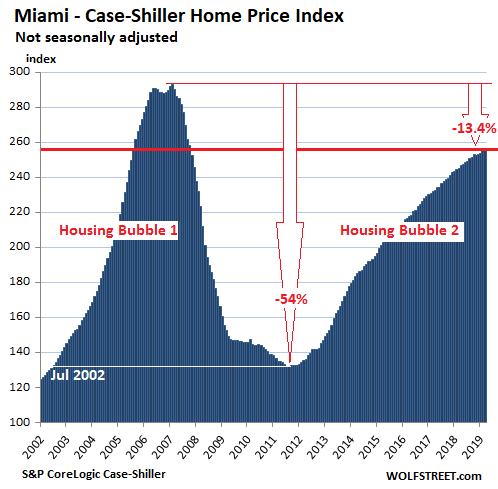
Miami:
In March, the Case-Shiller index for the Miami metro was flat with February. But in March last year, prices had ticked up 0.3%. So the year-over-year gain was whittled down to 4.5%. The index remains 13.4% below the crazy peak of Housing Bubble 1.
Miami was one of the epicenters of Housing Bubble 1 and Housing Bust 1. The index had peaked at 293 in February 2007, indicating that prices had nearly tripled in the seven years since January 2000. The collapse was equally epic. By August 2011, prices were back where they’d been in July 2002. Then it started all over again, but at a slightly slower pace:
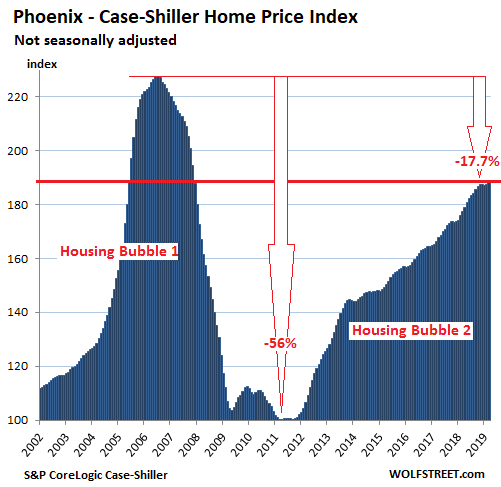
Phoenix:
House prices in the Phoenix metro – the unparalleled mind-bender of Housing Bubble 1 and Housing Bust 1 – rose 0.4% in March from February to a new post-Housing Bust 1 high. But in March last year, they’d risen at over twice that rate (1.0%), and so the big-fat year-over-year gain is slightly less big-fat, at 6.1% (down from 6.7% in the prior month). The index is now only 17.7% from its mind-bendingly crazy peak during Housing Bubble 1:
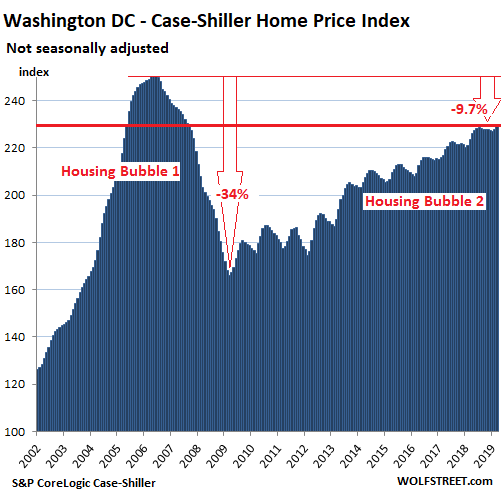
Washington DC:
House prices in the Washington D.C. metro ticked up 0.9% in March from February, to a new post-Housing Bust 1 high. But the gain was below the seasonal gain in March last year, which whittled down the year-over-year price gain to 2.8%. The index is now 9.6% below its ludicrous peak of Housing Bubble 1:
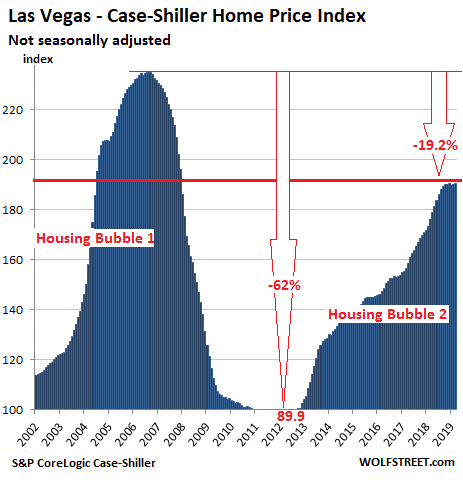
Las Vegas:
The Case-Shiller index for the Las Vegas metro was flat in March, compared to February. But in March last year, the seasonal gain had hit 1.5%. So the year-over-year gain (a fat 9.7% in February) was whittled down to a still fat 8.2%. The index has been essentially flat for six months, after a blistering rise in the first half last year:
A measure of house price inflation
The Case-Shiller methodology relies on “sales pairs,” comparing the sales price of a house in the current month to the last transaction of the same house, years earlier. This eliminates the issue of “mix” that skews median price indices and the issue of a few big outliers that skew average price indices. Since the Case-Shiller index tracks price changes of the same house (sales pairs) over time, it in effect tracks how many more dollars it takes to buy the same house, and thus it tracks the purchasing power of the dollar with regards to the same house — in other words, a measure of house-price inflation.