Wolf Richter wolfstreet.com, http://www.amazon.com/author/wolfrichter
Seattle house prices fall year-over-year. New York condos flat 24 months. San Francisco Bay Area flat 12 months despite startup millionaires. Los Angeles barely up from year ago. Boston ticks up...
“Home prices in the West continue their cooldown, with prices in Seattle falling for the third month in a row and home price growth in San Francisco falling very close to zero,” said CoreLogic in a statement about the release of its S&P CoreLogic Case-Shiller Home Price Index today. But prices are not cooling everywhere, and “second-tier markets in the South and Midwest continue to lead the country.”
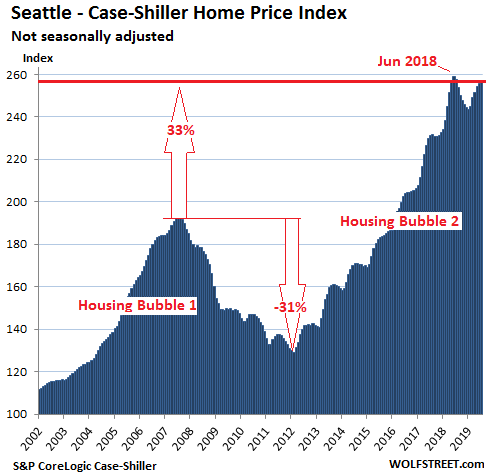
Seattle House Prices:
In the Seattle metro, prices of single-family houses ticked up 0.2% in July from June, but fell 0.6% from July 2018, according to the S&P CoreLogic Case-Shiller Home Price Index. It twas the third month of year-over-year declines in a row:

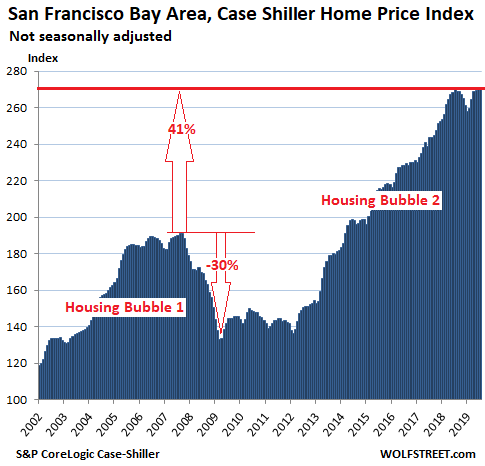
San Francisco Bay Area House Prices
House prices in the five-county San Francisco Bay Area – the counties of San Francisco, San Mateo (northern part of Silicon Valley), Alameda and Contra Costa (East Bay), and Marin (North Bay) – were flat in July compared to June, which whittled down the year-over-year price gain to near-zero (+0.15%), the lowest such gain since the end of Housing Bust 1 in March 2012, despite the countless IPO startup millionaires and billionaires raining down on the Bay Area:
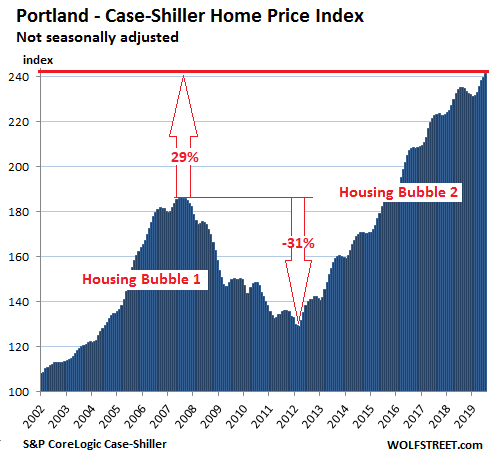
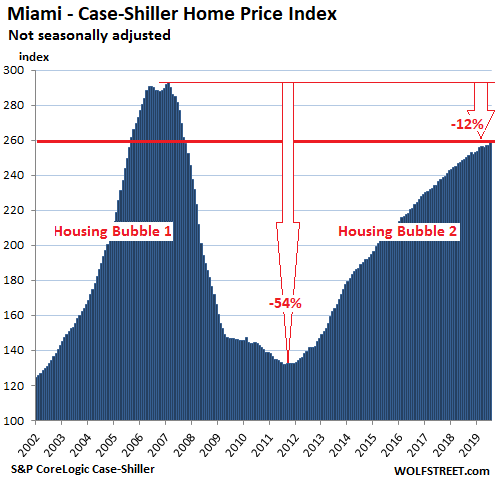
The Case-Shiller Index is a rolling three-month average. Today’s release represents closings that were entered into public records in May, June, and July. The index was set at 100 for January 2000. An index value of 200 means that prices have doubled since January 2000. Every one of the most splendid housing bubbles in America on this list has or had an index value of over 200, either during Housing Bubble 2 or during Housing Bubble 1.
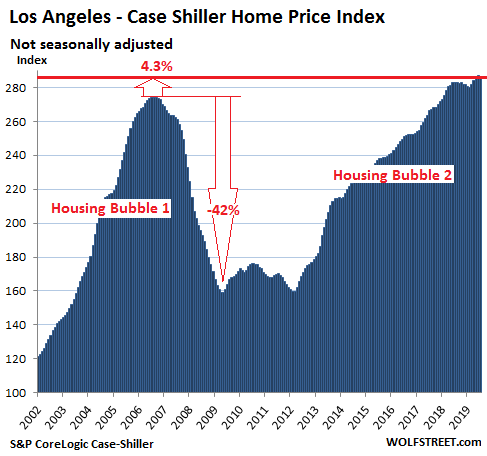
Los Angeles House Prices:
In the Los Angeles metro, house prices inched down 0.3% in July from June, which reduced the year-over-year gain to a mere 1.1%:
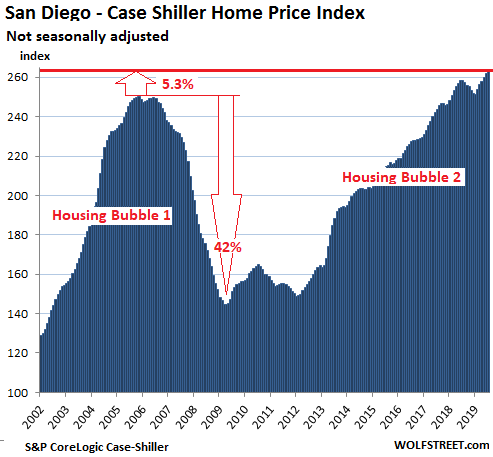
San Diego House Prices:
In the San Diego metro, house prices rose 0.7% in July compared to June and were up 2% from July 2018:
The Case-Shiller Index methodology is based on “sales pairs.” It compares the sales price of a house in the current month to the prior transaction of the same house, often years ago. In other words, the index tracks the percentage increase in how many dollars it takes to buy the same house over time. In this manner, the index tracks the purchasing power of the dollar with regards to houses in various markets. This makes it a measure of “house-price inflation.”
Portland House Prices:
In the Portland metro, house prices ticked up 0.7% in July from June, and were up 2.5% from July last year:
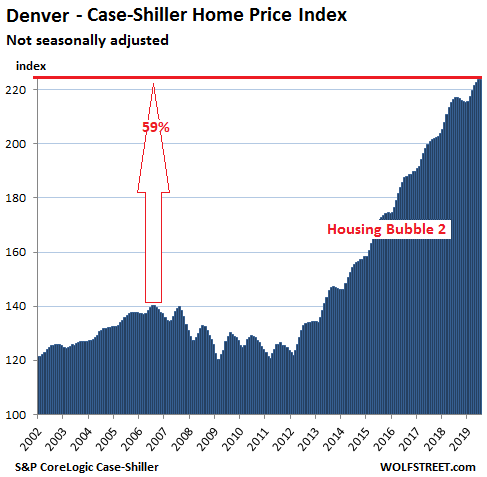
Denver House Prices:
House prices in the Denver metro were flat in July compared to June, which whittled down the year-over-year gain to 3.1%, the smallest such gain since April 2012:
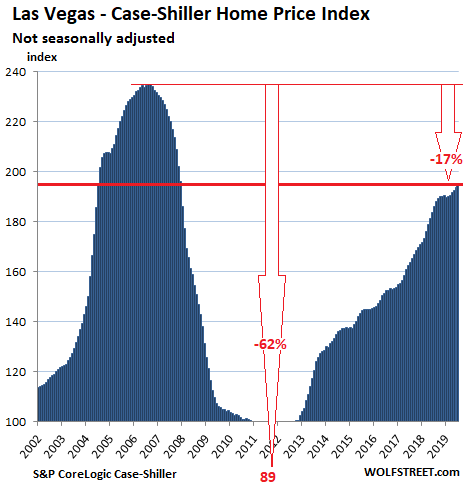
Las Vegas House Prices:
House prices in the Las Vegas metro rose 0.7% in July from June, further whittling down the year-over-year gain to 4.7% — from 5.5% in June, 6.4% in May, 7.1% in April, 8.2% in March, 9.7% in February, 10.5% in January, before which home prices had been increasing at double-digit rates since October 2017. The 4.7% year-over-year gain in July — as large as it was — was the smallest such gain since 2012, when Las Vegas was emerging from the Housing Bust. The index remains 17% below the totally crazy peak of 2006. Gambling in the desert:
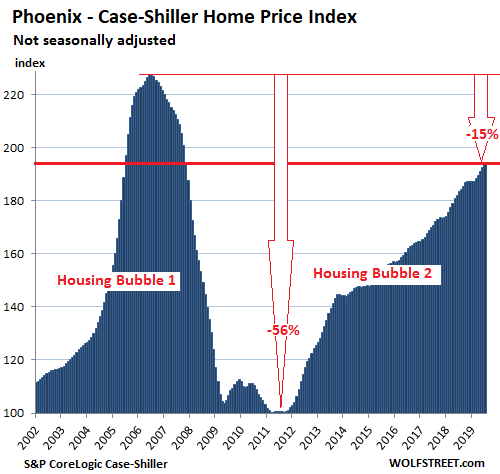
Phoenix House Prices:
The Case-Shiller Index for the Phoenix metro was flat in July compared to June and was up 5.8% from July last year. But it remains 15% below the nutty peak of 2006:
Miami House Prices:
In the Miami metro, house prices rose 0.6% in July from June and 3.9% year-over-year. They remain down 12% from their record-crazy peak at the end of 2006:
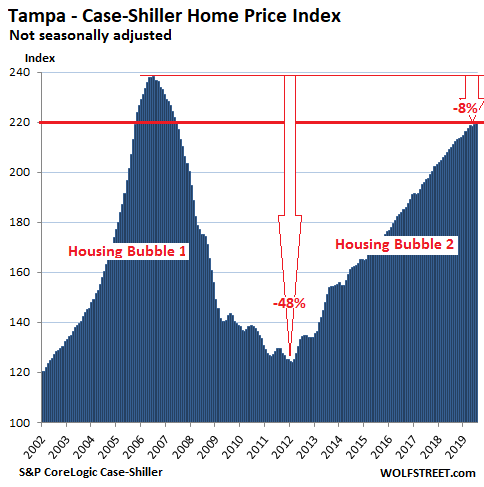
Tampa House Prices:
In the Tampa metro, house prices edged up 0.3% in July compared to June, which whittled the year-over-year gain down to 4.6%, yup, a pretty big gain, but the slowest such gain since August 2012. The index remains 8% below the crazy peak of 2006:
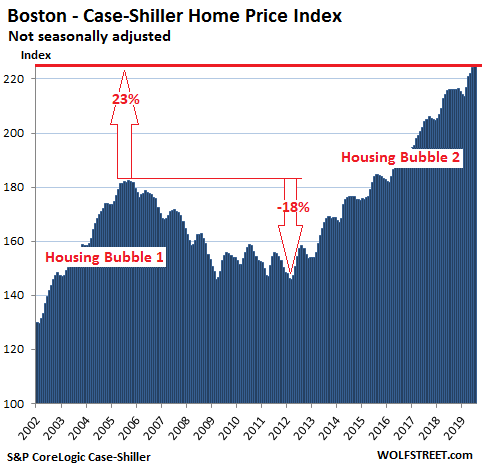
Boston House Prices:
House prices in the Boston metro ticked up 0.2% in July compared to June, and were up 3.9% year-over-year:
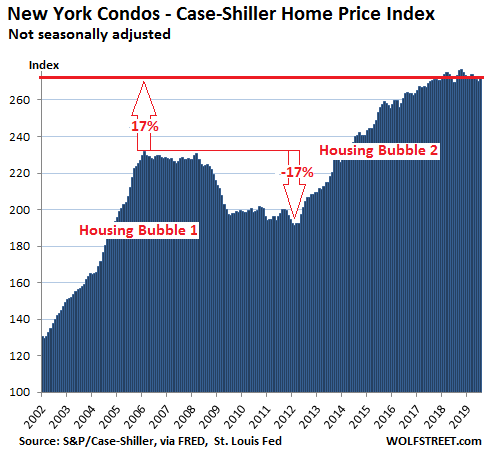
New York Condo Prices:
The Case-Shiller index for condos in the New York City metro rose by 0.9% in July compared to June. This caused the index to be 1.1% higher than in July last year, but still down 1.4% from October 2018. The index has essentially gone nowhere since August 2017:
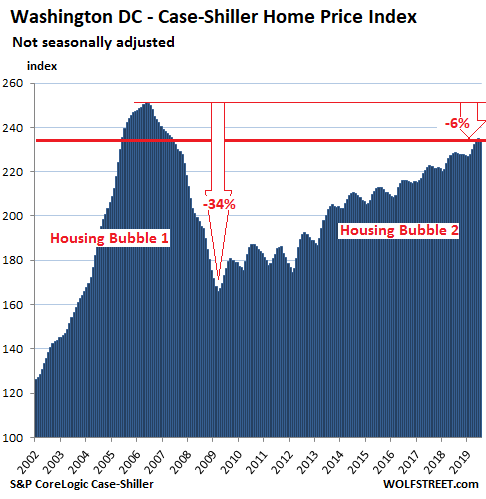
Washington DC:
House prices in the Washington D.C. metro fell a smidgen in July from June, which reduced the year-over-year gain to 2.7%:
“Wiring money overseas is not allowed for the purposes of purchasing real estate or insurance products”: a banker in China. Read… China Imposes New Capital Controls, Targets Foreign Real Estate Purchases, as Yuan Falls to 11-Year Low