Wolf Richter wolfstreet.com, http://www.amazon.com/author/wolfrichter
Seattle prices drop 5.1% in five months, most since Housing Bust 1; San Francisco Bay Area, Los Angeles, San Diego, Denver, Portland all decline.
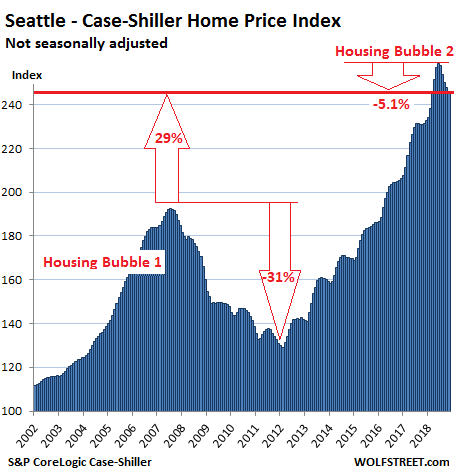
This is the most obvious one: Seattle. House prices in the Seattle metro dropped 0.7% in November from prior month, according to the Case-Shiller Home Price Index released this morning. It brought the index down 5.1% from the peak in June 2018, the biggest five-month drop since the five-month period that ended in January 2012 during the final throes of Housing Bust 1.
The historic spike through June is getting systematically unwound. The pace of the price declines over the past five months pencils out to be an annual rate of decline of 12%. The index is now at the lowest level since March 2018. Over the past 12 months, given the phenomenal spike into June, the index is still up 6.3% year-over-year and up 29% from the peak of Seattle’s Housing Bubble 1 (July 2007):
So some of the markets in this select group of the most spending housing bubbles in America have turned south, according to the S&P CoreLogic Case-Shiller Home Price Index, confirming other more immediate data. This includes, in addition to the Seattle metro, the five-county San Francisco Bay Area, the San Diego and Los Angeles metros, the Denver metro, and the Portland metro. In these markets, house prices have dropped the fastest since Housing Bust 1. In other markets, house prices have been flat for months, such as Dallas. And in a few markets on this list of the most splendid housing bubbles in America, the bubble remained intact and prices rose.
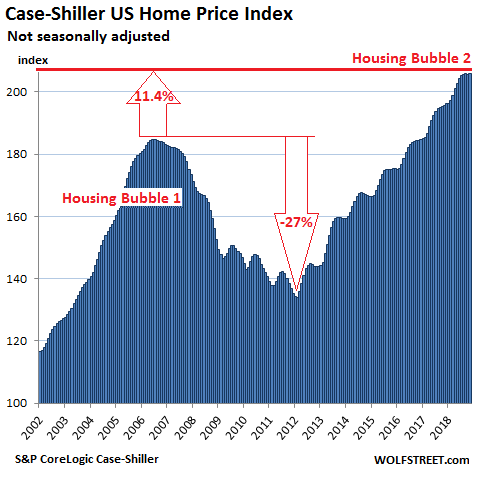
On a national basis, individual markets get averaged out. Single-family house prices in the US, according to the Case-Shiller National Home Price Index, have now been flat on a month-to-month basis for four months in a row, and are up 5.2% compared to a year ago (not seasonally-adjusted). This year-over-year growth rate has been ticking down gradually from the 6%-plus range prevalent through July 2018.
The index is now 11.4% above the July 2006 peak of “Housing Bubble 1” — as I named it because it was the first housing bubble in this millennium. It came to be called “bubble” and “unsustainable” only after it had begun to implode during “Housing Bust 1”:
The Case-Shiller Home Price Index is a rolling three-month average; this morning’s release is for September, October, and November data. And thus the index lags several months behind more immediate data, such as median prices. Based on “sales pairs,” it compares the sales price of a house in the current month to the prior transaction of the same house years earlier. It also incorporates other factors and formulas.
The index tracks single-family houses. In some large markets, Case-Shiller provides an additional index for condos. Unlike median-price indices, the Case-Shiller index does not indicate dollar-price levels. It was set at 100 for January 2000; a value of 200 means prices as tracked by the index have doubled since the year 2000. For example, the index value of the National Home Price Index for November is 205.85, indicating that house prices have risen 105.8% since the year 2000. Every index on this list of the most splendid housing bubbles in America, except Dallas and Atlanta, has more than doubled since 2000.
The index is a measure of inflation — of house-price inflation, where the same house requires more dollars over the years to be purchased. In other words, it tracks how fast the dollar is losing purchasing power with regards to buying the same house over time.
So here are the remaining metros in this list of the most splendid housing bubbles in America.
San Francisco Bay Area:
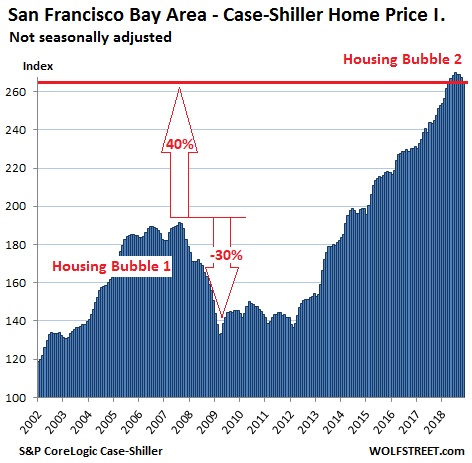
The Case-Shiller index for “San Francisco” includes five counties: San Francisco, San Mateo (northern part of Silicon Valley), Alameda, Contra Costa (both part of the East Bay ), and Marin (part of the North Bay). In November, the index for single-family houses fell 0.7% from October and 1.4% from September, to the lowest level since April. Since the peak in July 2018, the index is down 1.6%, the biggest four-month drop since March 2012.
The index was still up 5.6% from a year ago, after the surge in prices early 2018, and remains nearly 40% above the peak of Housing Bubble 1:
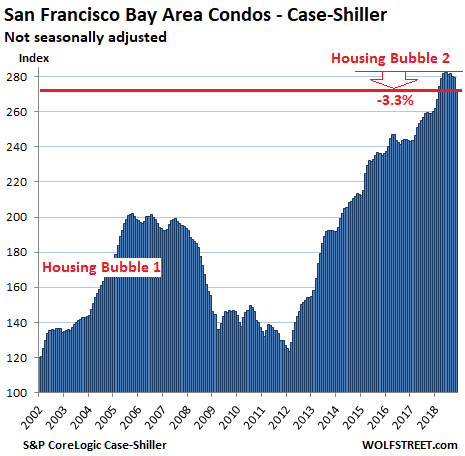
Also in the five-county San Francisco Bay Area, the Case-Shiller index for condo prices fell an ear-ringing 2.4% in November from October to the lowest level since February 2018, and is down nearly 3.3% from the peak in June 2018, the steepest five-month decline since the five months ended in February 2012, as Housing Bust 1 was winding down.
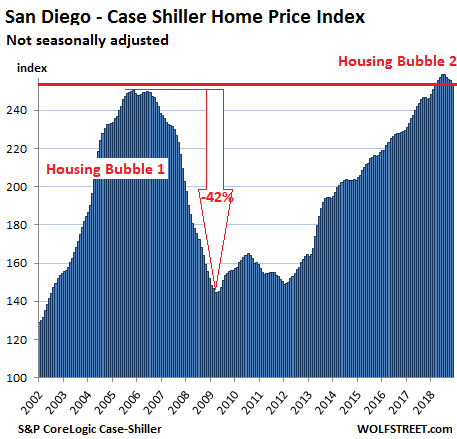
San Diego:
House prices in the San Diego metro declined 0.6% in November from October and are now down 1.2% from the peak in June, the biggest five-month drop since March 2012. This pushed the index to the lowest level since February 2018:
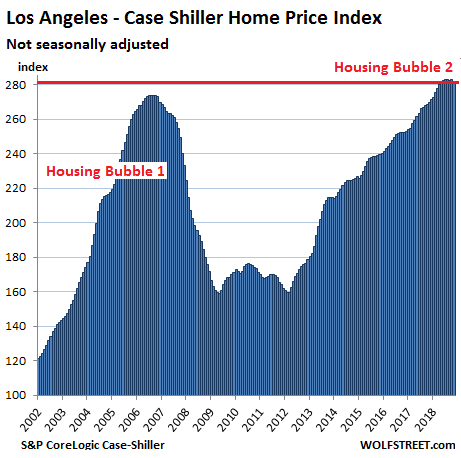
Los Angeles:
The Case-Shiller index for the Los Angeles metro edged down in November from October and is now down 0.4% from the peak in August. This sounds like nothing, but it was the largest three-month decline since the three months ended March 2012. The index is still up 4.2% from a year earlier:
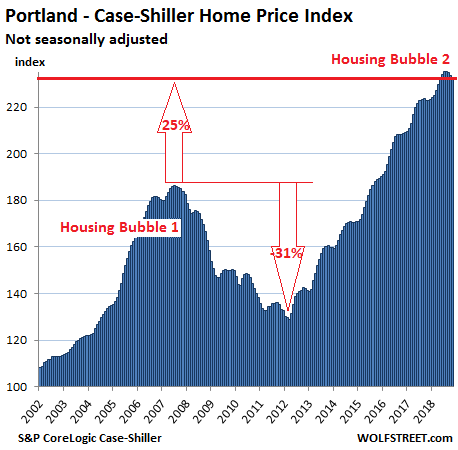
Portland:
House prices for the Portland metro in November fell for the fourth month in a row and are down 1.2% from the peak in July 2018, according to the Case-Shiller Index. And that was the steeped four-month drop since March 2012. Year-over-year, the index was up 4.4%:
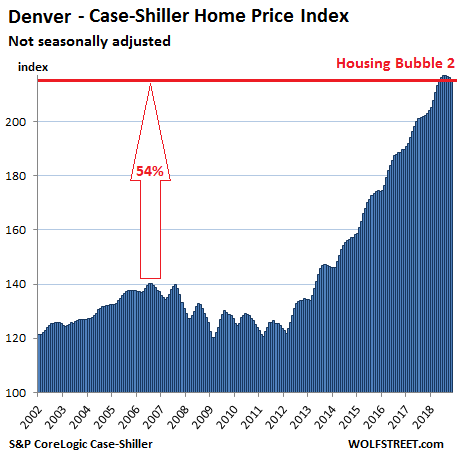
Denver:
The index for the Denver metro edged down in November for the fourth month in a row, after a perfect run of 33 monthly increases in a row. It took the index to the lowest level since May 2018. The four-month drop, small as it was at 0.8%, was the steeped such drop since March 2012. The index is still up 6.2% from a year ago:
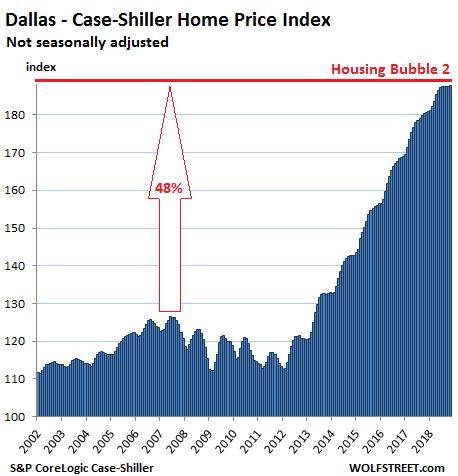
Dallas-Fort Worth:
House prices in the Dallas-Fort Worth metro in November were essentially flat for the sixth month in a row, after an uninterrupted run of 54 monthly increases. The year-over-year gain, at 4.0%, is down from the 5.0% range early and mid-2018:
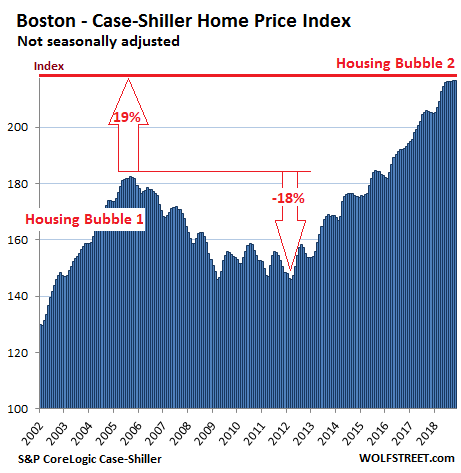
Boston:
In the Boston metro, house prices have been essentially flat for five months, and remain up 5.6% from a year ago, according to the Case-Shiller Index:
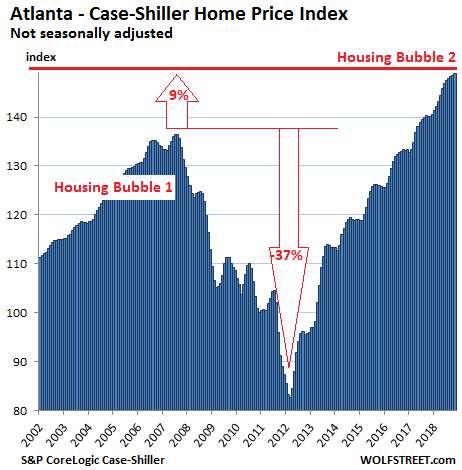
Atlanta:
House prices in Atlanta inched up a wee bit to a record in November and were up 6.2% from a year ago, according to the Case-Shiller Index:
New York City Condos:
The Case-Shiller index for condo prices in the New York City metro can be a little volatile. After ticking down several months in a row in mid-2018, they then jumped three months in a row, but in November, they fell again. The end-effect is that the index is up 2.1% from November 2017, which is the lowest year-over-year price gain in this list of the most splendid housing bubbles in America:

With Seattle’s economy still strong, the downturn in its housing market isn’t caused by layoffs & defaulting mortgages. The fabulous bubble has run out of steam on its own. Read… Housing Bubble Trouble in the Seattle-Bellevue Metro