Authored by Sven Henrich via NorthmanTrader.com,
Oops, he did it again. The second there was any concern in markets about tapering or the potential of earlier than expected interest rate hikes as suggested in last week’s Fed dot plot Jay Powell hurried to assure investors that the dot plot was meaningless and when Bullard dropped a 2022 rate hike bomb suggestion on Friday both Powell and Williams, aided by Kashkari on Friday, immediately put a stop to any such notion this week. After all Bullard is not a voting member and so who cares what he says. Voting members stay on script non voting members and ex officials can be more bold and reality prone in their assessments.
Markets promptly followed the cue as usual assured that the liquidity spigot will remain open for an extended time and that was that. Dip bought, new all time highs on tech and $SPX within not even a stone’s throw of new all time highs.
The never ending rally. All that matters is the Fed staying easy and printing no matter that house prices may have increased 18% year over year, no matter a 5% CPI print. We don’t look at CPI we only look at PCE so Powell went in front of the Congressional committee yesterday.
No, last week’s trial balloon by the Fed, if that was the intent, made it clear again that this market runs not only on easy money, but also on the continued expectation of easy money and so the Fed followed its long adopted approach to monetary policy: Go in big, go in fast, and go out excruciatingly slow for fear of the consequences of upsetting markets.
So what about this latest dip buying exercise and new highs. Script as usual? One always looks for signals and change to see if anything is afoot and that was part of the discussion during my appearance on CNBC TechCheck yesterday:
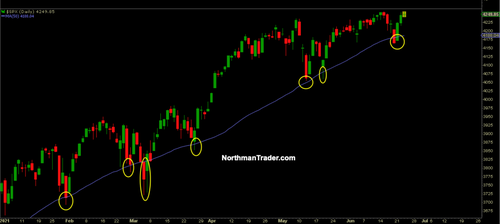
Firstly a key recognition that the extraordinary artificial liquidity equation remains in full control of asset prices for now. The $SPY ETF may track the S&P 500, but the S&P 500 appears to be simply tracking the Fed’s balance sheet. Since November every new high in the Fed’s balance sheet has been followed by a new high in the S&P and any dip into the 50 day moving average gets bought:
The combination of both fiscal and monetary stimulus and the reopening of the economy has not only led to an extraordinary bounce in growth, but also has propelled many asset prices to the proverbial moon, and the moon is becoming a very busy place as narratives, meme and short running have replaced fundamentals as the backdrop for investing. This has led to unprecedented risk on investor behavior and has spilled into the tech sector in particular.
Additional liquidity from fiscal and now from record buybacks have placed a rock solid put under a market that appears to mirror the market of 2013: Steady ascent higher, shriveling volatility save the occasional spikes, and virtually no corrective activity in the main indices. As such one can make the argument that as long as liquidity remains in control markets will remain on a steady ascending path with dips continuing to be bought. However it is important to recognize we are in a very different valuation environment now then compared to 2013 finding ourselves in the largest disconnect of asset prices versus the overall economy ever with market cap vs GDP at a never seen before 203% and price to sales on the S&P at a never before seen 3.1.
For now dip buying reigns relentless as we saw this again this week with new highs in the Nasdaq. Yet while we’ve liked tech as dip buying play from a technical perspective we are getting a bit more cautious on this index.
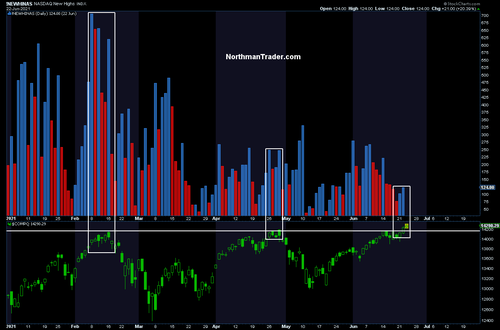
For one new highs have been internally deteriorating. For example in February new Nasdaq highs come with over 600 new highs in the index, the late April new highs come with only 250 new highs, and yesterday’s new highs came with only 124 new highs:
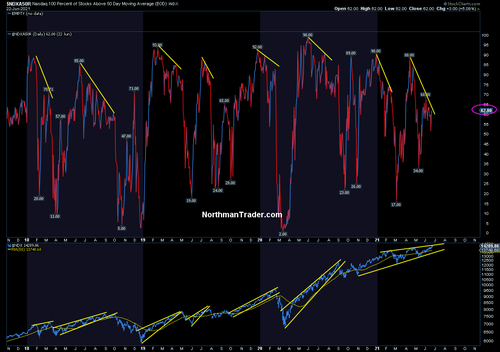
Furthermore we can observe that ever fewer components are above their 50 day moving averages again showing relative weakening:
What’s driving this?
In tech we need to differentiate between 2 key aspects of the sector, I call them both monopoly markets. One, the big quasi monopolies of global tech, $AAPL, $AMZN, $GOOGL, $MSFT, $FB, all in stable charts either consolidating or on steady ascents to new highs. Valuations are high, but so are buybacks associated with them. These stocks are again driving most of the gains in the index, confirming the narrowing of the rally.
The other monopoly market is not driven by market dominance but rather by monopoly money, excessive liquidity leading to hyper speculative activity and while the index does not reflect this in aggregate we’re actually seeing rolling boom and bust cycles, outright bear markets in tech as the narratives can’t maintain the ascent in the valuations.
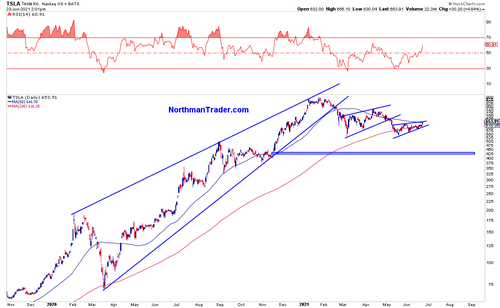
Think Tesla, peaked in January, then dropped 40%, think SPACs, peaked in February and dropped nearly 40%, think companies such as ARKK or even Coinbase, and also crypto with $Bitcoin peaking in April, absolutely disaster zones for people coming in late chasing these charts and this raises the question if these are indicative of a market bubble in process of bursting despite still new highs in the indices or if they can repair their damaged charts and I referenced the 50MA being recaptured by Tesla as potential positive sign in context of yet another potential bear flag forming:
For now considering these rolling bear markets it is actually very impressive that the larger tech sector has not suffered any major damage, but it raises the question of sustainability of new highs and much will depend on if these busted charts can repair themselves and rally off recent lows..
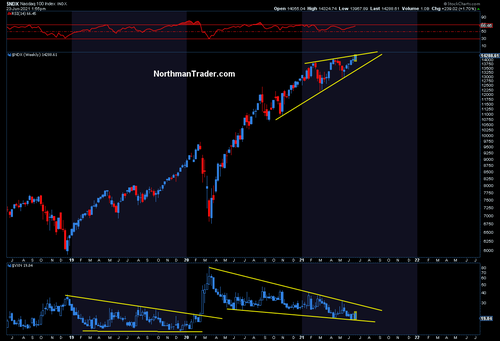
While most people are focused on the $VIX $NDX actually has its own volatility component, the $VXN and the chart is fascinating:
With every excuse to reach the volatility lows of 2019/2020 note that $VXN is building a similar pattern that led to a volatility breakout in 2020 but this pattern is on top of the previous pattern. That is an odd divergence and suggestive that the current calm in markets will not last, especially if new highs cannot be sustained, so key to watch for either a broadening of the rally or signs of new highs failing following a 5 week consecutive ascent in tech.
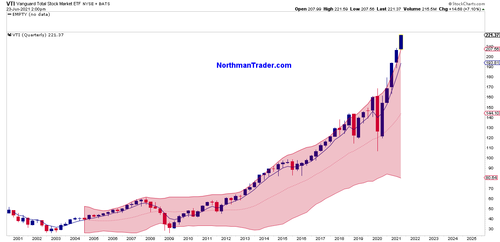
In context next week’s quarter end will be of interest highlighting how stretched the overall charts are in a historic context:
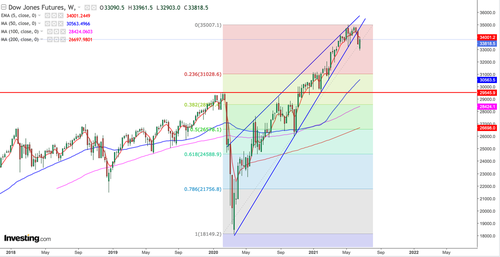
VTI hasn’t even really touched its upper quarterly Bollinger band and is far above the quarterly 5 EMA. There is no history of sustainability, hence my comment about reversion risk into the next quarter. Per 2013 any larger reversions into the 100MA for example would likely initially be bought, but trend breaks in context of hyper valuations bear watching as in the $DJIA index that I mentioned in the interview:
The trend has clearly broken and not only in the $DJIA but in a number of other indices as well, but so far consequence free. But note: These markets are so extended and stretched with participants so trained to buy every tiny dip even a basic technical retrace to the .236 fib for example would seem like Armageddon unleashed.
In recent years any dips into late June were followed by another rally to new highs in July, with shriveling summer volume this may indeed again be the script for this year. For now this market is on total autopilot ignoring everything fully focused on continued liquidity being sufficient to justify never before seen valuation metrics.
Investors don’t seems to care as an “all-in” mentality has settled in:
Yeehaw. pic.twitter.com/D34AiYpBja
— Sven Henrich (@NorthmanTrader) June 23, 2021
No, the buy any dip mentality is so pervasive in the firm belief that the market is bulletproof because it acts that way that by the time this market actually does correct nobody will believe it. It could be an expensive lesson to be learned for all rallies end, even the ones that never end.
* * *
For the latest public analysis please visit NorthmanTrader. To subscribe to our market products please visit Services.

