by Dana Lyons

Battered broker-dealer stocks are testing a potentially key line of support.
Entering 2018, one of the hottest – and one of our favorite – industries was the broker-dealer space. That mantle of relative strength was further reinforced by the group’s resilience in the post-January correction. In fact, the group, as measured by the NYSE Broker-Dealer Index (XBD), was among the first to return to new highs, doing so by late February. After strong follow-through into March, however, it has been a different story.
In the back half of March, the XBD saw a drawdown of nearly 10%. And a less than explosive rally back had us selling our broker-dealer position in mid-April. After some chopping around for the next month, the group was headed back lower again, undercutting those March lows in the past few days. So is there any hope for this languishing group?
Well, presumably it would help if interest rates resumed their ascent that had assisted, or at least corresponded with, the late-2017/early-2018 rally in broker-dealer stocks. And with the 30-Year Yield testing key support at 2.95%, an impending bounce in yields may be just what the doctor ordered. Of course, that is conjecture, to some degree. However, fortunately for broker bulls, the XBD is also approaching a formidable collection of potential technical support layers near the 270 level.
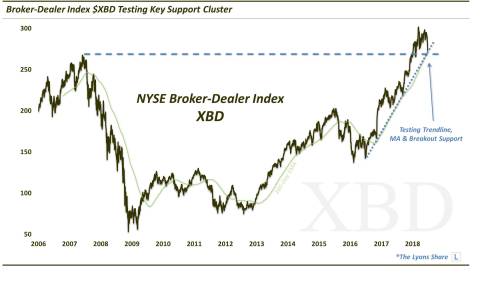
As we showcased in today’s (early) edition of #TrendlineWednesday on Twitter, the XBD is presently testing a key Up trendline stemming back to its 2016 Brexit low, and connecting the election low in November 2016 and the low in September 2017. In addition, its 200-day simple moving average is also presently intersecting the ~270 level. Last but not least, the XBD’s former all-time high set back in 2007 also sits near the — you guessed it — 270 level.
The early year breakout above that 2007 former all-time high was one of the reasons that we were so high on the index. However, we are not at all surprised to see the XBD test that breakout level here — in fact, we would have been surprised if it hadn’t tested that major breakout level. We would also be surprised if the level did not hold as support, at least temporarily. Thus, we expect a decent sized mean-reversion bounce off of the 270 level — at least big enough to make for a worthwhile long trade. Even the slightest mean-reversion bounce should carry the index to near 278, with the next profit-taking levels at 283, 287 and 291.
The nearest Fibonacci Retracement cluster as we see it is near the 264 level. And a breakout of this magnitude demands a little bit of leeway. Therefore, we would add further exposure at 264 — and only a close decisively below the 264 level would have us out of the trade. All things considered, the risk/reward ratio of this setup appears to be firmly in the bulls’ favor — again, if only for a mean-reversion bounce.
So how to take advantage of this setup? The iShares Broker-dealer ETF (ticker, IAI) does a nice job of at least moving in tandem with the XBD. Indeed, the IAI is also testing its post-Brexit Up trendline along with its 200-day simple moving average near 63.80, or exactly where it closed today. Though IAI’s former all-time high is way lower, near 58.50, and there appears to be no good Fibonacci support until a cluster in the low 62’s, we’d trade IAI off of the XBD chart. That is, buy the IAI when the XBD tests support and use XBD’s resistance and stop-loss triggers as well. If IAI does get a bounce from nearby prices, and you want to use IAI profit-taking points, they are most likely at these levels: 65.00, 65.80, 66.50 and 67.20.
As always, stay tuned to our Daily Strategy Session videos for updates on this potential mean-reversion long trade.