Wolf Richter wolfstreet.com, http://www.amazon.com/author/wolfrichter
But no letup in freight rates yet.
In November, according to transportation data provider FTR, orders for new Class-8 trucks — the heavy trucks that haul the products of the goods-based economy across the US — plunged nearly 50% from July and August, 35% from October, and 15% from November 2017, to 27,500 orders, the lowest all year.
This chart shows the year-over-year change of monthly Class-8 truck orders that truck makers have booked:
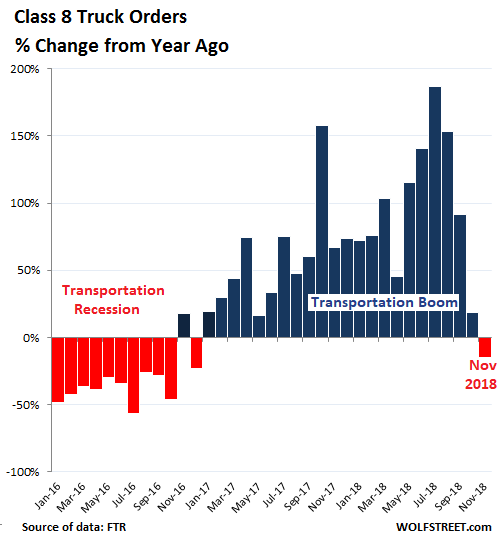
Red-hot demand for transportation services this year and late last year, especially by truck, caused shortages, spiking freight rates, shipping delays, and more gray hair among shippers, while truckers were scrambling to order new trucks to meet the demand, and truck makers, swamped with orders saw their backlog balloon to 11 months, and records were broken on a monthly basis. But suddenly the hot air is hissing out of the market.
The chart above shows just how cyclical this business is:
- The effects of the “transportation recession” on Class-8 truck orders in 2015 and 2016 when orders collapsed to the lowest level since 2009, triggering layoffs at truck and engine makers;
- The blistering boom in orders leading to record backlog for truck makers, amid component shortages and supply-chain bottlenecks;
- And now the beginning of the next phase in the cycle.
Truck makers aren’t going to hurt just yet. Over the past 12 months, Class-8 truck orders have reached nearly 500,000 according to FTR data. Truck makers are running at capacity, building trucks at an annual rate of about 320,000 units. Some cancellations have started to come in, but the backlog extends way into next year. The chart below shows that orders in November plunged from the super high levels that had peaked in July and August at 52,000, but were still above the levels of the transportation recession:
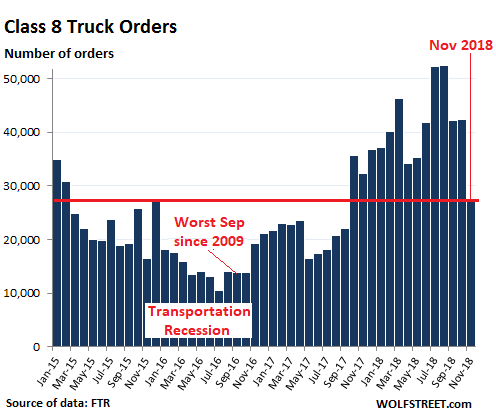
“27,500 is not that bad of a number,” said Don Ake, FTR vice president of commercial vehicles.
Truckers were motivated to put in these record orders earlier this year because freight demand had been enormous, and there wasn’t enough equipment to move it, and they were able to raise rates and make more money. Now they see demand backing off, and overcapacity, created during boom times is precisely why this industry is so cyclical.
And growth of demand for transportation is now stalling. Freight shipment volume across all modes of transportation – truck, rail, air, and barge – was essentially flat in November compared to November 2017, and about flat with November 2014 (the other recent banner year), according to the Cass Freight Index. This year-over-year no-growth is down from growth in the double-digits earlier this year. The index covers merchandise for the consumer and industrial economy but does not include bulk commodities, such as grains or chemicals:
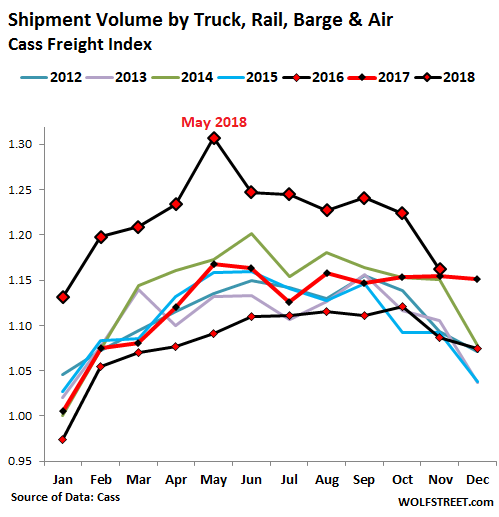
The chart above shows just how powerful the boom in late 2017 and in the first three quarters of 2018 had been. Note the seasonal drops starting in October every year – except in 2017 (red line). This was the beginning of the boom that has now run its course, with shipments still strong, but flat with November 2017 and November 2014.
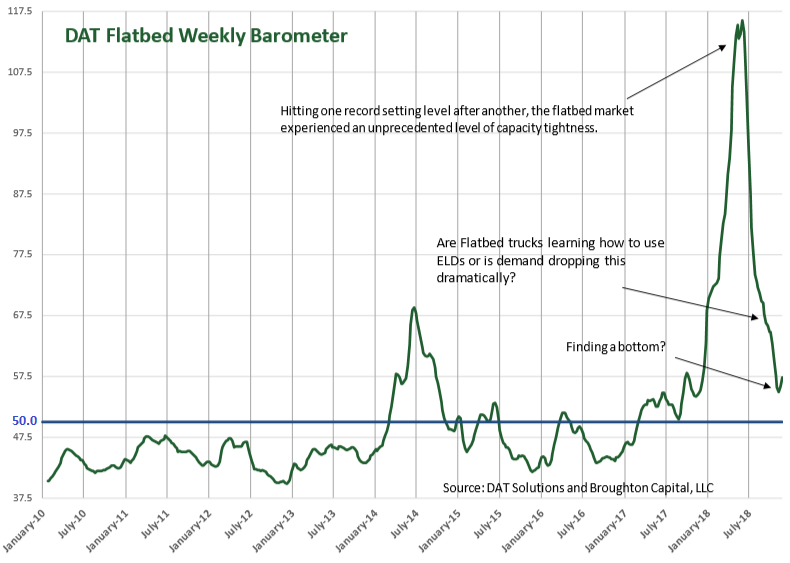
Demand for transportation from the industrial sector is reflected in demand for flatbed trailers that haul equipment and supplies for manufacturing, oil-and-gas drilling, construction, etc. Demand for flatbed trailers too surged late last year, but capacity suddenly tightened in January 2018 in part due to the newly required use of Electronic Logging Devices (ELDs).
As a result, the DAT Flatbed Monthly Barometer, which tracks demand-capacity imbalances, spiked to historic highs. But the indicator, cited by Cass in its report, has now plunged back closer to earth. The horizontal blue line (=50) indicates that supply and demand for flatbed trailers are in balance. So for now there is still slightly more demand for flatbed trailers than supply, with the indicator being above 50, but a far cry from the historic spike earlier this year (click to enlarge):
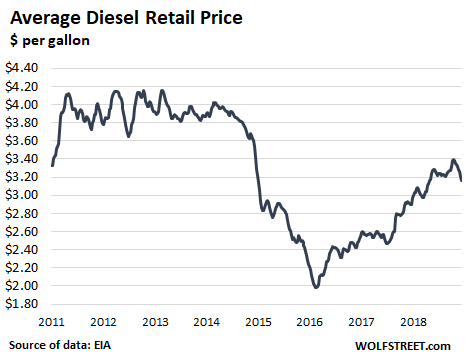
But freight rates and fuel surcharges have shown no signs of backing off just yet, as price pressures continue.
The average price of diesel at the pump, according to EIA data, has been edging back down ever so reluctantly from the cycle peak in October ($3.40 a gallon), despite the 30% plunge in the price of crude oil since then. At $3.16 a gallon, the average retail price of diesel is still up 8.6% from a year ago:
And freight rates are still hot. The total amount companies spent on shipping their merchandise via all modes of transportation – by truck, rail, air, and barge – rose 8.4% in November compared to a year ago. This is a result of flat shipment volumes but at higher prices that continue to squeeze the margins of shippers. But that 8.4% increase was a far cry from the year-over-year growth of freight expenditures between 12% and 19% in the prior 12 months:
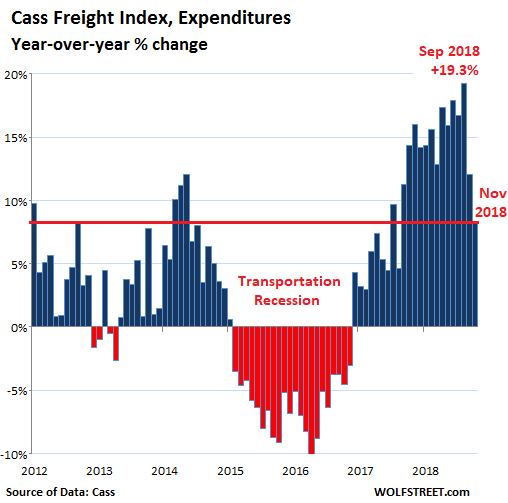
The chart above also shows just how massive the boom has been and how sharp the wind-down now is. At the moment – if the wind-down doesn’t go much further – it means a return to something perhaps considered “normal,” a reversion to the mean, if you will. But the industry is known for its wild cyclicality.
It now faces a mind-boggling build-up of businesses inventories around the country that in part has powered the transportation boom over the past year-and-a-half. But business, as they invariably do, will sooner or later deal with these inventories to trim them back down, which will entail less demand for transportation services. And a classic overshoot on the way down for demand in the transportation sector, as we have seen during the last transportation recession, would then be on the schedule for sometime next year.