Wolf Richter wolfstreet.com, http://www.amazon.com/author/wolfrichter
What, first down-tick in Seattle?
The S&P CoreLogic Case-Shiller National Home Price Index for September, released today, jumped 6.2% year-over-year (not-seasonally-adjusted). By comparison, consumers’ nominal disposable income (not adjusted for inflation) rose only 2.9%. When population growth is factored in, this disposable income on a “per-capita” basis, hence for consumers as individuals, grew about 2%, less than a third of the jump in the national home price index. This disconnect, year after year, adds up after a while.
The Case-Shiller national home price index has now surpassed by 5.9% the crazy peak in July 2006 of Housing Bubble 1:
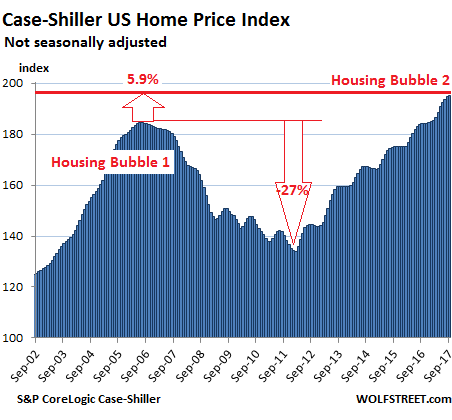
While real estate prices are subject to local dynamics, they’re also impacted by the consequences of monetary policies, particularly in places where the liquidity flows to. This creates local housing bubbles. When enough local bubbles occur simultaneously, it becomes a national housing bubble. See chart above.
And here are the magnificent local housing bubbles of major metro areas in the US:
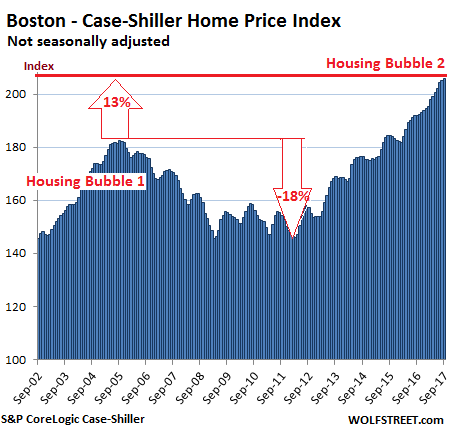
Boston:
The index for the Boston metro area ticked up again on a monthly basis in its relentless manner and has surged 7.2% year-over-year. During Housing Bubble 1, it soared a blistering 82% from January 2000 to October 2005, before the plunge set in. Now, after six years of price surges, it exceeds the peak of Housing Bubble 1 by 13%:
Seattle:
The Case-Shiller home price index for the Seattle metro declined a smidgen on a month-to-month basis from the record set at the last reading. It was the first monthly decline since January 2015! First sign of a let-up? Maybe not yet. The index is not seasonally adjusted, and a slight downturn this time of the year was not unusual before 2015. The index is still up an astounding 12.9% year over year and is now 20% above the peak of Housing Bubble 1 (July 2007):
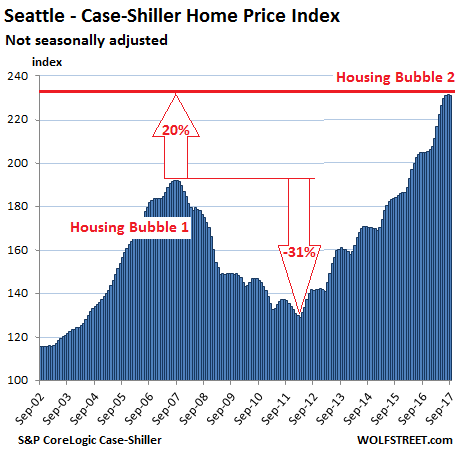
The Case-Shiller Index is based on a rolling-three month average; today’s release was for July, August, and September data. Instead of median prices, the index uses “home price sales pairs.” It looks, for instance, at a house that sold in 2011 and then again in 2017. Algorithms adjust this price movement and incorporate other factors. The index was set at 100 for January 2000. An index value of 200 means prices have jumped 100%. For example in Seattle, the index was at 230.9, indicating that prices have soared 130% since January 1, 2000.
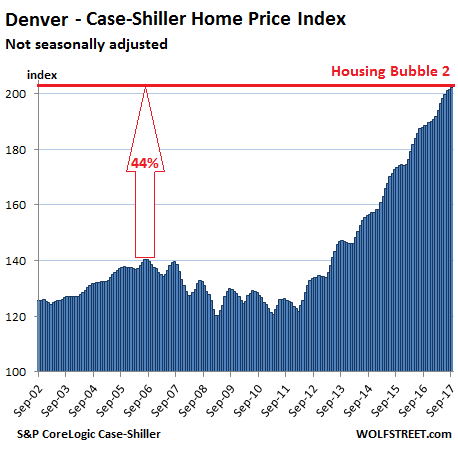
Denver:
The index for the Denver metro ticked up on a monthly basis, is up 7.2% year-over-year, and has surged 44% above the prior peak in the summer of 2006. When Housing Bubble 1 was inflating in many big markets, home prices in Denver gained “only” about 12% in four years but were spared much of the crash that hit other markets on the way down. But in 2012, Housing Bubble 2 erupted with a vengeance:
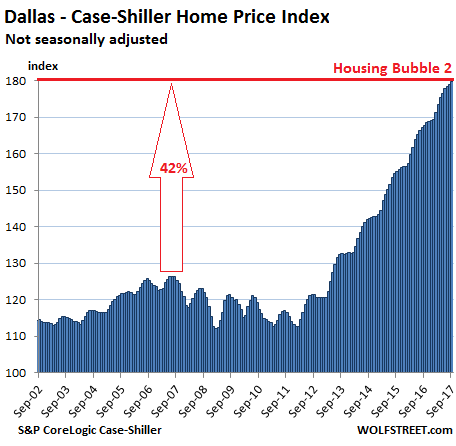
Dallas-Fort Worth:
The index for the Dallas-Fort Worth metro rose again on a monthly basis and is now up 7.1% year-over-year and 42% from the prior peak in June 2007. During Housing Bubble 1, when North Texas home prices rose “only” 13% in five years, a sense of very unwelcome housing sanity prevailed, but this changed in 2012:
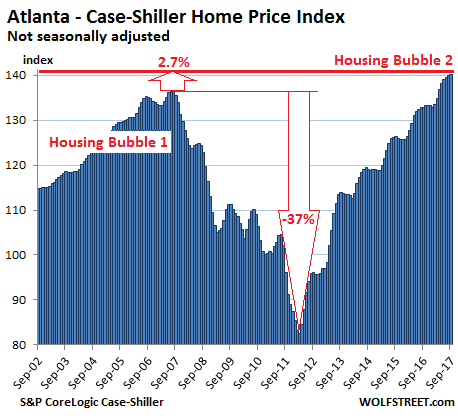
Atlanta:
Home prices rose 5.4% year-over-year and are now 2.7% above the peak of Housing Bubble 1 in July 2007. From that peak, the index plunged 37%. It’s now up 70% since February 2012:
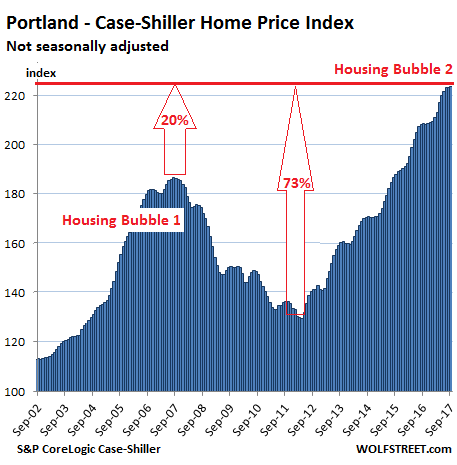
Portland:
The Case-Shiller index for Portland inched up again on a monthly basis, but barely — in line with a seasonal flattening out of prices. The index and is up 7.3% year-over-year. Prices have soared 73% in five years, are 20% above the crazy peak of Housing Bubble 1, and have ballooned 123% in 17 years:
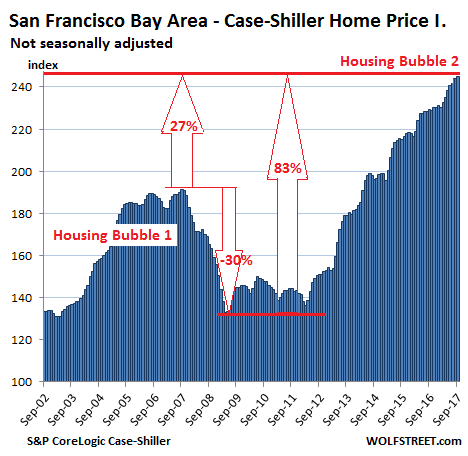
San Francisco Bay Area:
The index, which covers the county of San Francisco plus four Bay Area counties, rose again for the month, after ticking down last month. Monthly seasonal declines this time of the year are not uncommon. It’s up 7.0% year-over-year, up 27% from the crazy peak of Housing Bubble 1, and up 83% from the end of the housing bust, when the liquidity from central bank monetary expansion washed ashore in the Bay Area:
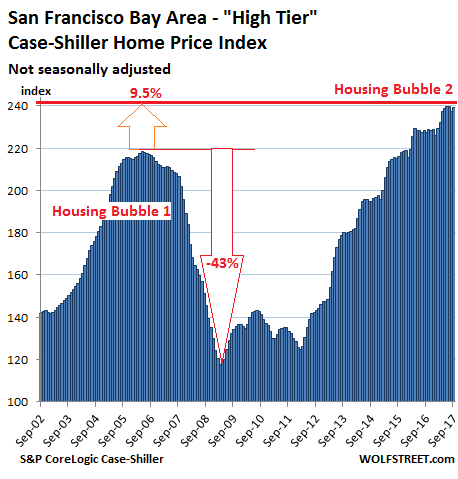
Case-Shiller also offers a “High Tier” index for the five-county Bay Area. This is sometimes taken as more indicative of price movements in the county of San Francisco itself due to its home prices that are much higher than in some of the other counties in the index.
The “High Tier” index has been flat for the past four months and is up 5.2% year-over-year. The index tanked 43% during the housing bust but has now surged 9.5% past the prior peak during Housing Bubble 1:
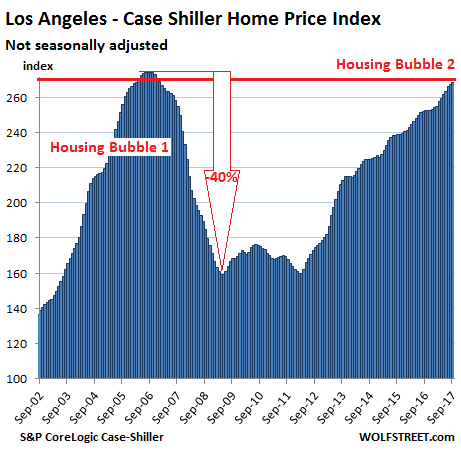
Los Angeles:
The index rose for the month and is up 6.2% year-over-year. Few cities can compete with LA’s beautiful sugar-loaf Housing Bubble 1, where home prices skyrocketed 174% from January 2000 to July 2006, before giving up much of it on the downhill side. The index has skyrocketed since the bust but is still 2.2% shy of its prior insane peak of July 2006:
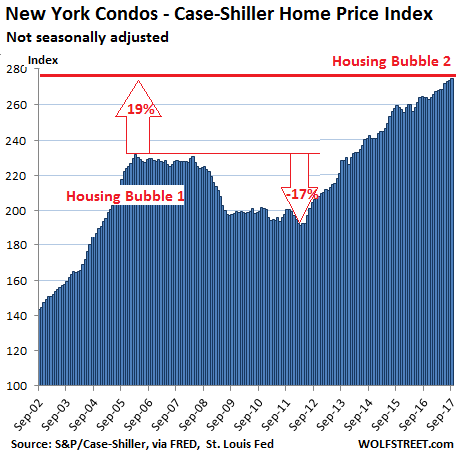
New York City Condos:
The condo bubble in New York City inflated another notch and is up 4.0% year-over-year. The index skyrocketed 131% from 2000 to February 2006 during Housing Bubble 1. It barely deflated during the bust before the Fed’s flood of money inundated Wall Street. The index is 19% above the peak of Condo Bubble 1 and has soared 175% over the past 17 years:
These charts are images of asset price inflation. A home whose price jumps 50% in five years didn’t get 50% bigger. Instead, the purchasing power of the dollar with regards to these homes has been crushed under the Fed’s policies that infamously produced no wage inflation, moderate consumer price inflation, and extraordinary asset price inflation. These policies have devalued the fruits of labor with regards to assets, as housing costs are eating up an ever larger chunk of wages — hence the “affordability crisis” — which doesn’t make for a healthy economy.
The housing market in California is getting tripped up by “eroding affordability and persistently low inventory.” Read… Housing Bubble 2 Hits Rough Spot in California