Financialization of everything, Insurance Rules, Tech & Software Red-Hot, Health Care Eats into Everything. We can just sue each other to boost GDP.
By Wolf Richter for WOLF STREET.
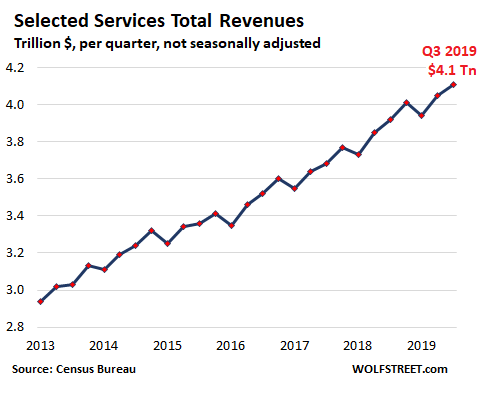
Services-producing industries – not including government services – dominate the US economy, amounting to the equivalent of 70% of overall GDP by value added, and to 80% of the private sector economy. As long as the services-producing industries grow enough, it’s tough for the US economy to fall into a recession. And in the third quarter, according to the Commerce Department’s Quarterly Selected Services Estimates, revenues by the services-producing industries rose 4.9% from a year ago, to a record $4.11 trillion (not seasonally adjusted). For the first three quarters of the year, revenues rose 5.2% to $12.1 trillion:
Four huge industries dominate the services sector and together generated $2.94 trillion in revenues in Q3, accounting for 71.5% of total service revenues (share of each compared to total services revenues):
- Finance and insurance: 31.6%.
- Healthcare: 16.7%
- Professional, scientific, and technical services: 12.6%
- Information services: 10.7%.
During the Financial Crisis, financial and insurance services were getting hit hard as banks were in the process of collapsing, and real estate, which is also hefty, was already collapsing. And it spread from there. That’s what it takes in the US to cause a deep recession – the biggies have to give and contagion has to spread.
But now services-producing industries are growing, and financial and insurance services are hopping, and insurance services alone are blowing them all away – as consumers have no doubt noticed, because someone has to pay for it when the US economy is becoming ever more financialized. So here we go, by sector.
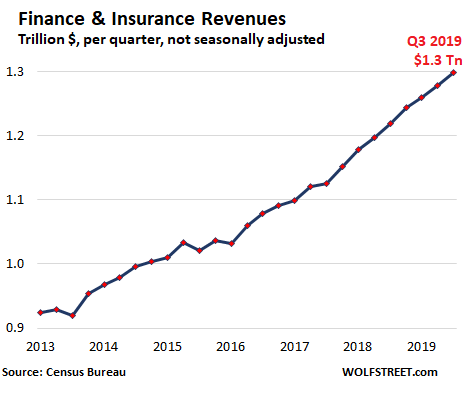
#1 Finance and Insurance.
Finance-and-insurance revenues jumped 6.6% to a record $1.3 trillion in Q3. For the three quarters so far in 2019, revenues jumped 6.7% to $3.84 trillion:
Unlike government services, the Federal Reserve is included in finance and insurance revenues because its 12 regional Federal Reserve Banks are owned by the financial institutions in their districts and thus are part of the private sector. The Fed’s revenues are largely from interest earned on the $4 trillion in bonds it holds. In Q3, revenues fell 11.7% year-over-year, to $25 billion. But in terms of revenues, the Fed is a bit-player in the industry, accounting for just 1.9% of total finance and insurance revenues.
The giant in this group is the “insurance” category of finance and insurance. Insurance dominates the industry both in magnitude and growth, with revenues soaring 8.2% in the quarter to $733 billion. In other words, 18% of all services revenues are from insurance.
The “finance” category includes the banking sector, whose revenues grew by 5.1% year-over-year to $361 billion. This includes commercial banks (they take deposits) and nonbanks or shadow banks (they don’t take deposits). As the table below shows, in terms of revenues, they’re neck to neck. Both grew just over 5% in the quarter, and over 7% year-to-date (if your smartphone clips the five-column table, hold the device in landscape position):
| Q3 2019, $ billions | Change fr. Q3 2018 | YTD 2019, $ billions | Change fr. YTD 2018 | |
| Finance & insurance | 1,299 | 6.6% | 3,836 | 6.7% |
| Finance & insurance (except the Fed) | 1,275 | 7.0% | 3,758 | 7.1% |
| The Fed | 25 | -11.7% | 78 | -8.4% |
| Banking |
361 | 5.1% | 1,074 | 7.1% |
| Deposit-taking banks | 167 | 5.2% | 492 | 7.1% |
| Nonbanks | 167 | 5.1% | 501 | 7.4% |
| Activities related to credit intermediation | 28 | 4.3% | 81 | 4.5% |
| Securities brokers, exchanges, investment activities |
180 | 6.0% | 527 | 3.0% |
| Securities and commodity contracts, intermediation and brokerage | 82 | 7.7% | 242 | 4.1% |
| Securities and commodity exchanges | 3 | 24.9% | 10 | 11.4% |
| Other financial investment activities | 95 | 4.1% | 276 | 1.8% |
| Insurance | 733 | 8.2% | 2,157 | 8.2% |
| Insurance carriers | 631 | 8.5% | 1,858 | 8.7% |
| Agencies, brokerages, and other insurance related | 103 | 6.9% | 299 | 4.8% |
#2. Healthcare and Social Assistance
Healthcare and social assistance revenues rose 4.4% year-over-year to $690 billion in Q3 and 4.8% year-to-date to $2.1 trillion. However, these are services only and do not include the goods-portion of healthcare, such as pharmaceutical products, medical devices, supplies, etc.
The largest of the four categories, “ambulatory health care,” generated $271 billion in revenue in Q3, of which $133 billion was generated by doctors’ offices. Note that the growth rates vary, with revenues at medical and diagnostic labs growing only 0.9% year-to-date but revenues at hospitals overall growing 5.5% and at specialty hospitals soaring 7.1%:
| Q3 2019, $ billions | Change fr. Q3 2018 | YTD 2019, $ billions | Change fr. YTD 2018 | |
| Health care and social assistance | 690 | 4.4% | 2,064 | 4.8% |
| Ambulatory health care (doctors, diagnostics, outpatient, home health care) | 271 | 3.6% | 802 | 3.2% |
| Offices of physicians | 133 | 3.1% | 392 | 2.5% |
| Outpatient care centers | 37 | 7.5% | 111 | 6.1% |
| Medical and diagnostic laboratories | 13 | 1.0% | 39 | 0.9% |
| Home health care services | 22 | 1.3% | 65 | 2.8% |
| Other ambulatory health care services | 10 | 5.8% | 29 | 3.8% |
| Hospitals | 302 | 4.5% | 912 | 5.5% |
| General medical and surgical hospitals | 281 | 4.3% | 849 | 5.4% |
| Psychiatric and substance abuse hospitals | 7 | 4.4% | 21 | 3.7% |
| Specialty (except psychiatric and substance abuse) hospitals | 14 | 7.8% | 42 | 7.1% |
| Nursing and residential care facilities | 67 | 6.0% | 199 | 6.6% |
| Social assistance | 50 | 5.9% | 151 | 6.6% |
| Individual and family services | 26 | 3.7% | 80 | 6.5% |
| Community food and housing, and emergency and other relief services | 9 | 10.8% | 26 | 7.2% |
| Vocational rehabilitation services | 4 | 3.1% | 11 | 5.7% |
| Childcare services | 11 | 8.8% | 34 | 6.5% |
#3. Professional services
Professional services revenues jumped 6.0% in Q3 to $516 billion; and rose 4.7% year-to-date to nearly $1.51 trillion. The largest category, “computer systems design and related services,” generated $117 billion in revenues in Q3, up 5.8% year-over-year. The second largest category is lawyering, which is booming, of course, with revenues growing 6.6% in Q3 to $88 billion. Year-to-date the sector is close to a quarter-trillion bucks. We can all just sue each other to boost GDP.
Advertising services had declining revenues. However, these services (NAICS code 5418) do not include the amounts of running the actual ads, which fall under various other revenue categories, such as in publishing, broadcasting, etc. This category here only includes revenues at ad agencies and the like that create ad campaigns and place them in the media.
| Q3 2019, $ billions | Change fr. Q3 2018 | YTD 2019, $ billions | Change fr. YTD 2018 | |
| Professional, scientific, and technical services | 516 | 6.0% | 1,513 | 4.7% |
| Legal services | 88 | 6.6% | 246 | 4.8% |
| Accounting, tax preparation, bookkeeping, payroll services | 42 | 5.6% | 144 | 3.4% |
| Architectural, engineering, and related services | 92 | 6.5% | 264 | 3.0% |
| Computer systems design and related services | 117 | 5.8% | 343 | 7.0% |
| Management, scientific, technical consulting services | 75 | 8.5% | 213 | 5.5% |
| Scientific research and development services | 46 | 6.0% | 139 | 8.6% |
| Advertising, public relations, related services | 26 | -1.4% | 76 | -2.0% |
#4. Information Services
Revenues rose 5.8% to $434 billion in Q3, and 6.2% year-to-date to $1.28 trillion. But this growth was very unequally distributed. A number of categories have declining revenues, particularly in the paper publishing segments. Telecommunications, the biggie, was stagnant at $158 billion in Q3.
But revenues at software publishers soared 13.2% in Q3 to $70 billion, revenues at firms that provide data processing and hosting services (think “the cloud”) skyrocketed by 17.9%, and other information services soared by 15.6%:
| Q3 2019, $ billions | Change fr. Q3 2018 | YTD 2019, $ billions | Change fr. YTD 2018 | |
| Information | 434 | 5.8% | 1,281 | 6.2% |
| Publishing industries (except Internet) | 93 | 8.4% | 277 | 8.6% |
| Newspaper publishers | 6 | -4.9% | 18 | -3.3% |
| Periodical publishers | 6 | -4.7% | 19 | -4.1% |
| Book, directory and mailing list, other publishers | 11 | -3.6% | 29 | -4.4% |
| Software publishers | 70 | 13.2% | 211 | 13.3% |
| Motion picture and sound recording industries | 27 | -1.4% | 83 | 0.2% |
| Broadcasting (except Internet) | 42 | 0.7% | 127 | 1.8% |
| Radio and TV broadcasting | 21 | 1.9% | 63 | 4.4% |
| Cable and other subscription programming | 21 | -0.4% | 64 | -0.6% |
| Telecommunications | 158 | 0.4% | 471 | 1.6% |
| Wired carriers | 78 | -0.2% | 234 | 0.4% |
| Wireless carriers (except satellite) | 67 | 0.2% | 200 | 2.0% |
| Other telecommunications | 13 | 5.0% | 38 | 6.7% |
| Data processing, hosting, related services | 55 | 17.9% | 155 | 15.5% |
| Other information services | 59 | 15.6% | 168 | 15.2% |
#5: Transportation services
Revenues in this sector — from transporting regular folks by aircraft to pumping natural gas through pipelines — barely ticked up 1% in the quarter to $255 billion and 2.3% year-to-date to $746 billion. Overall growth was dragged down the by the decline in trucking.
Revenues at trucking and delivery companies, the sector’s largest category, fell 2.9% in the quarter and 1.4% year-do-date, in line with the downturn in the trucking industry:
| Q3 2019, $ billions | Change fr. Q3 2018 | YTD 2019, $ billions | Change fr. YTD 2018 | |
| Transportation and warehousing | 255 | 1.0% | 746 | 2.3% |
| Air transportation | 60 | 2.8% | 173 | 3.6% |
| Water transportation | 13 | 1.5% | 36 | 5.5% |
| Truck transportation | 75 | -2.9% | 218 | -1.4% |
| Transit and ground passenger | 9 | 2.0% | 30 | 3.8% |
| Pipelines | 13 | 3.6% | 39 | 4.5% |
| Scenic, sightseeing transportation | 1 | 11.4% | 3 | 11.6% |
| Support activities for transportation | 48 | -0.3% | 145 | 1.6% |
| Couriers and messengers | 25 | 7.6% | 75 | 6.5% |
| Warehousing and storage | 10 | 4.0% | 29 | 7.0% |
#6: Administrative & Support Services.
Revenues ticked up just 0.8% in the quarter to $231 billion, but grew 3.0% year-to-date to $681 billion:
| Q3 2019, $ billions | Change fr. Q3 2018 | YTD 2019, $ billions | Change fr. YTD 2018 | |
| Administrative and support | 231 | 0.8% | 681 | 3.0% |
| Employment, and travel reservation servies | 105 | -0.3% | 313 | 4.4% |
| Travel arrangement and reservation services | 13 | -2.3% | 38 | -0.1% |
| Other administrative and support services | 113 | 2.2% | 330 | 2.1% |
#7: Rental and leasing services
These are the services involved in renting and leasing, not the actual rent payments and lease payments. Total revenues grew 6.8% to $195 billion in the quarter. Real-estate renting and leasing activities dominate this sector, growing at 8.0% in the quarter, to $136 billion:
| Q3 2019, $ billions | Change fr. Q3 2018 | YTD 2019, $ billions | Change fr. YTD 2018 | |
| Rental and leasing, real estate, auto, etc. | 195 | 6.8% | 552 | 6.5% |
| Real estate | 136 | 8.0% | 382 | 7.3% |
| Lessors of real estate | 74 | 4.3% | 215 | 6.0% |
| Offices of real estate agents and brokers | 32 | 11.2% | 85 | 6.1% |
| Activities related to real estate | 30 | 0.0% | 82 | 0.0% |
| Rental and leasing services | 46 | 2.3% | 133 | 4.1% |
| Auto, truck, equipment rental & leasing | 18 | 3.7% | 51 | 5.3% |
| Consumer goods rental | 6 | 3.8% | 18 | 3.6% |
| Commercial, industrial machinery, equipment | 21 | 0.9% | 62 | 3.5% |
| Lessors of nonfinancial intangible assets (except copyrighted works) | 13 | 10.8% | 37 | 6.8% |
#8 Utilities
These revenues by utilities do not include revenues by government-owned utilities but only privately-owned utilities. And they only include revenues from services, such as line charges for distribution, but not revenues from the products such as natural gas, and those revenues ticked down in the quarter and year-to-date:
| Q3 2019, $ billions | Change fr. Q3 2018 | YTD 2019, $ billions | Change fr. YTD 2018 | |
| Utilities | 158 | -0.5% | 449 | -0.2% |
| Electric power generation, transmission and distribution | 136 | -0.4% | 362 | -0.3% |
| Natural gas distribution | 18 | -1.2% | 76 | -0.1% |
| Water, sewage and other systems | 4 | -1.1% | 11 | -0.5% |
#9: Arts, entertainment, and recreation.
| Q3 2019, $ billions | Change fr. Q3 2018 | YTD 2019, $ billions | Change fr. YTD 2018 | |
| Arts, entertainment, and recreation | 78 | 4.5% | 218 | 6.5% |
| Performing arts, spectator sports, & related | 35 | 2.0% | 94 | 5.0% |
| Performing arts companies | 5 | 1.8% | 14 | 3.1% |
| Spectator sports | 13 | 4.6% | 33 | 3.1% |
| Promoters of performing arts, sports, and similar events | 9 | 9.3% | 25 | 12.0% |
| Agents, managers for artists, athletes, entertainers, and other public figures | 2 | 0.9% | 7 | 9.4% |
| Independent artists, writers, and performers | 5 | 0.0% | 15 | 0.0% |
| Museums, historical sites, and similar | 4 | -7.6% | 12 | -1.9% |
| Amusement, gambling, and recreation industries | 39 | 8.3% | 112 | 8.8% |
#10: Accommodation Services.
Revenues grew 4.4% in the quarter to $67 billion. For the full year 2018, this sector was the only one that booked a revenue decline.
| Q3 2019, $ billions | Change fr. Q3 2018 | YTD 2019, $ billions | Change fr. YTD 2018 | |
| Accommodation, traveler and RVs | 67 | 4.4% | 191 | 2.8% |
| Traveler accommodation | 64 | 4.4% | 185 | 2.7% |
| RV (recreational vehicle) parks and recreational camps | 2 | 6.0% | 5 | 6.0% |
Some other services.
Waste Management and Remediation, small, but growing at a good clip:
| Q3 2019, $ billions | Change fr. Q3 2018 | YTD 2019, $ billions | Change fr. YTD 2018 | |
| Waste management and remediation services | 27 | 4.5% | 79 | 5.7% |
The hodgepodge that doesn’t fit anywhere else lineup, also grew at a decent clip in the quarter, and at strong clip year-to-date:
| Q3 2019, $ billions | Change fr. Q3 2018 | YTD 2019, $ billions | Change fr. YTD 2018 | |
| Other services (except public administration) | 144 | 3.6% | 432 | 7.0% |
| Repair and maintenance | 48 | 6.0% | 141 | 2.9% |
| Death care services | 5 | -0.9% | 14 | -1.3% |
| Drycleaning and laundry services | 8 | 2.7% | 23 | 4.3% |
| Religious, grantmaking, civic, professional, similar organizations | 66 | 1.1% | 200 | 11.3% |
And a recession?
Revenue growth in services being this strong, and with services dominating the economy, it would require a major downturn in the already weak goods-producing sector to drag the overall economy into a recession.
On the other hand, the downturn could originate in services — such as financial services as was the case during the Financial Crisis, or a tech bust as was the case in 2000 — which, given the magnitude of these services, would quickly drag down the overall of the economy. But that’s is not happening yet.