Stocks got creamed yesterday, but thanks to late day manipulation, they ended up well off the bottom.
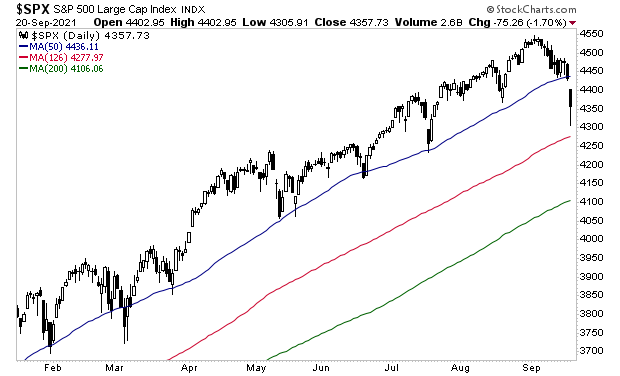
From a purely technical perspective, the S&P 500 has broken below its 50-day moving average (DMA) for the first time since March 2021. Stocks then bounced hard off the 126-DMA (six month moving average).
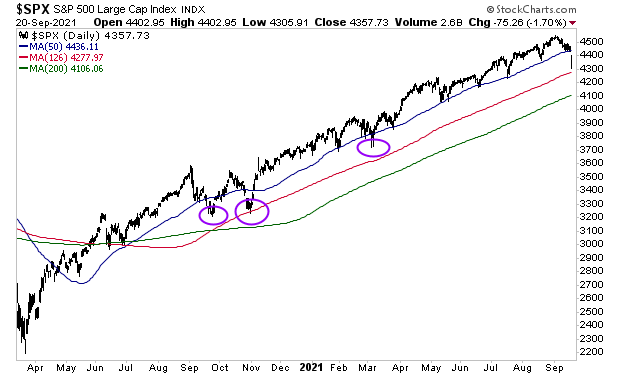
It will be crucial to see how the markets act the next few days. We’ve had three significant breaks below the 50-DMA since the March 2020 bottom: one in September ’20, October ’20 and March ’21 (purple circles in the chart below). All of those were resolved in a little over a week.
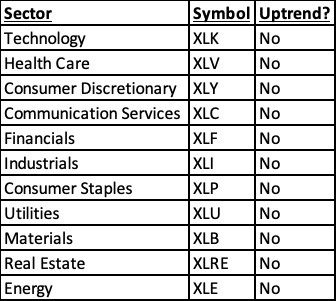
On the surface things don’t look that bad. But “underneath the hood” things are terrible. None of the S&P 500’s sectors are in uptrends.
Moreover, four out of the five most heavily weighted stocks (AAPL, FB, AMZN, and GOOGL) have lost their 50-DMAs and are losing their uptrends.
This is the kind of environment in which actual crashes can happen.
To figure this out, I rely on certain key signals that flash before every market crash.
I detail them, along with what they’re currently saying about the market today in a Special Investment Report How to Predict a Crash.
To pick up a free copy, swing by
https://phoenixcapitalmarketing.com/predictcrash.html
Best Regards