by UPFINA
As of Monday’s close, the S&P 500’s 14 day RSI (relative strength index) hit 75.2 which is the highest of the year and the highest reading since the peak in January 2018. As if we needed more metrics to show the market is overbought, the chart below shows the S&P 500’s divergence from its 200 day moving average in relation to its one month forward returns.
When S&P 500 index runs ahead of its 200d MA by +5% or more, as it has recently, forward 1 month returns are poor:
chart via Richardson GMP pic.twitter.com/ETTPngqUY1
— Babak 🇺🇦 🌻 (@TN) November 20, 2019
When the market is more than 5% above its 200 day moving average, returns are weak. The purple bars highlight previous periods when the market was overextended. It’s no surprise the subsequent returns were negative. You can see the January 2018 peak was the farthest away from the 200 day moving average, but the peak last September led to the greatest decline. We generally do not discuss technical analysis on this website, unless circumstances are historically at important levels that need to be considered.
The clear takeaway here is the market is primed for about a 5% correction, but it could be more. Potential negative catalysts include the trade war escalating further, the market readjusting future growth expectations, and the 2020 election causing business investment to weaken. It’s clear the market is ignoring current economic reports because it sees a turnaround in 2020. If the turnaround is delayed or isn’t as sharp as expected, stocks should fall.
Strong Residential Construction
The housing market is probably going to help Q4 GDP growth which needs all the help it can get as some estimates call for below 1% growth. As you can see from the chart below, housing starts were 1.314 million which rose from 1.266 million, but slightly missed estimates for 1.32 million.
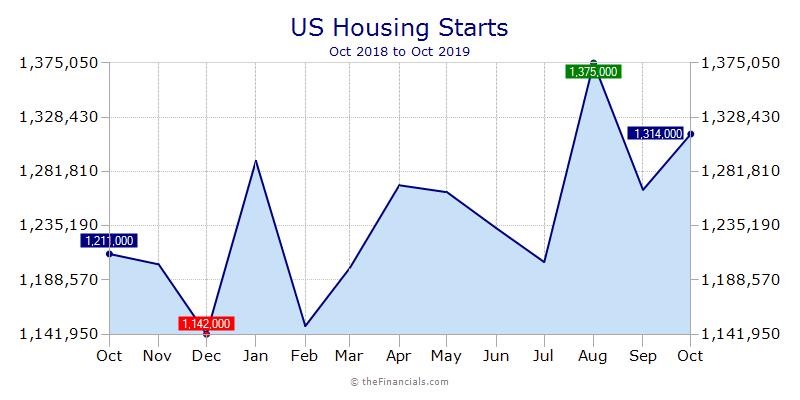
Permits were even better as they increased from 1.391 million to 1.461 million which beat estimates for 1.378 million and the high end of the expected range which was 1.4 million. This was a 12 year high for permits. This signals starts will improve further in the next few months.
The 3 month average of single family starts and permits were 923,000 and 888,000 which were also 12 year highs. Multifamily starts and permits were up 8.6% and 8.2%. Completions were up 10.3% monthly to 1.256 million. This report pushed the Atlanta Fed’s estimate for GDP growth up 0.1% to 0.4%. This shows how relatively small this portion of the GDP report is. The estimate for real residential investment growth rose from -2.3% to 0.5%. This would be the 2nd straight quarter where the housing market helps GDP growth. Low mortgage rates are helping the housing market. While long yields may have bottomed, we have seen them decline recently. The average 30 year fixed rate increased 6 basis points to 3.75% in the week of November 14th, but that increase might be reversed soon.
Slight Decline In Housing Market Index
The November housing market index fell from 71 to 70 which missed estimates for 71, but was still solid. The table below breaks down the data by sub-index and region.
Homebuilder sentiment declined in November, but three of the four regional indices increased. $ITB https://t.co/c5lv8wIb9s pic.twitter.com/dpVm0nSpY5
— Bespoke (@bespokeinvest) November 18, 2019
The present sales and traffic indexes fell from 78 and 54 to 76 and 53. The future sales index rose 1 point to 77. The index rose in all regions, but the South. That’s possible because the South is the largest region. Its 2 point decline to 74 was enough to drag the headline index down. The Northeast, Midwest, and West increased from 60, 57, and 83 to 63, 58, and 85.
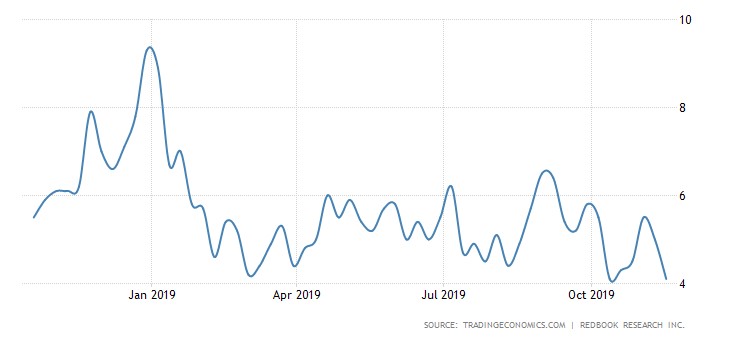
Redbook Sales Growth Falls Again
In the week of November 16th, Redbook same store sales growth fell from 5% to 4.1%. Historically, that’s relatively strong growth, but as you can see from the chart below, that ties for the weakest growth in the past 12 months. The data will be more important later in the month as the holiday shopping season starts on Black Friday which is the 28th. To be clear, this report isn’t always accurate. You can see the huge burst in growth in December 2018, which was far from matched by the retail sales report as retail sales growth was the worst of the cycle.
The recent relative weakness in Redbook sales growth has similar timing to the 3 week decline in the Bloomberg consumer comfort index which was the biggest collapse since 2008. That makes it more relevant. Consumers could be weakening at the exact worst time of the year or they could be saving money for holiday shopping. Saving more explains the weakness in Redbook sales growth, but not consumer comfort as saving for the holidays doesn’t cause consumers to be more pessimistic.
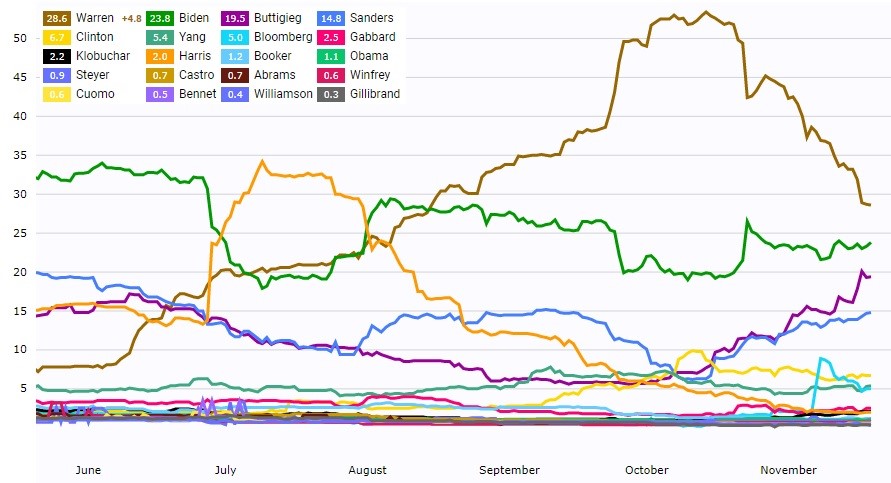
Update On Democratic Primary
As we head into the November 20th Democratic debate, Elizabeth Warren is losing momentum quickly. This has been a huge boon for the managed care names. As you can see from the chart below, the average betting odds on Warren winning the nomination were 53.4% on October 14th and now they are just 28.6%. She’s barely the favorite to win. In that period, the iShares Dow Jones US Healthcare ETF which is symbol IHF (top 8 holdings are managed care firms) is up 19.45%. It’s a few percentage points off its record high.
Warren has lost momentum to Pete Buttigieg who is leading the average of Iowa polls and is leading the latest New Hampshire poll. In the average of Iowa polls, Buttigieg has 21% and Warren has 18.8%. Buttigieg was up on Warren and Biden by 10 points in the latest New Hampshire poll as he got 25% support. On Predictit, Buttigieg has a 12% better chance of winning Iowa than Warren and a 3% better chance of winning New Hampshire than Sanders and Warren. The question is if Buttigieg wins the first 2 states, can he gain national appeal? His average in the national polls is only 8.3% which is a distant 4th place. Biden is at 27% which is the lead. Of course, the outcome of all this will have implications for financial markets, hence why we are discussing this.