by Marin Katusa via International Man

A bull market can make an average or even rookie investor feel smarter than a Wall Street or Bay Street vet.
First time investors are throwing darts at a board blindfolded and coming up with big winners.
They’re putting their “Stimmy’s” (stimulus checks) to work in Robinhood—getting free stock for signing up and watching their “stonks” rise.
The thrill of big gains in stocks is juicing the loins of a whole new generation of traders and investors.
If TikTok is any indicator…
There has been an explosive growth in accounts picking stocks and predicting which will rise.
A couple even went viral with a video showing a “sure-fire” way to make money:
“Here’s my strategy in a nutshell: I see a stock going up and I buy it and I just watch it until it stops going up and then I sell it. And I do that over and over and it pays for our old lifestyle.”
More evidence of how the hype from these TikTok investors is influencing the markets can be seen in how small caps have been performing relative to the rest of the market in the last three months:
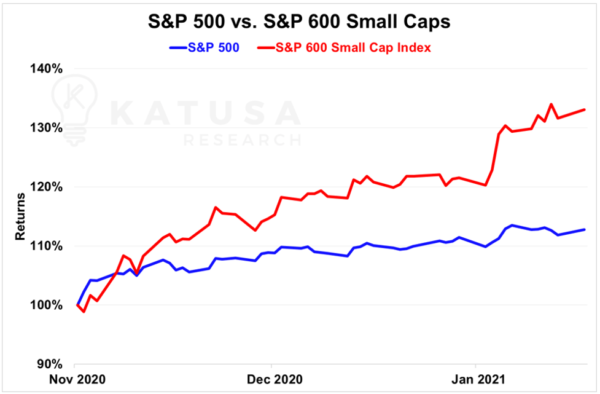
Big wins on penny stocks are the dream for any wannabe investor.
And that surge of interest and capital has led to irrational exuberance in buying small cap junior companies.
If it was that easy, you probably wouldn’t be reading this right now.
The Wall of Worry…
One of the key concerns for me that I believe could be a catalyst for a market correction is in the bond market.
Over the next 5 years, a significant portion of the lowest investment grade rated bonds (Triple B) along with the High Yield or “Junk” bonds (bonds rated below Triple B) will mature.
Companies will have to either repay the capital, or issue new debt to replace the existing debt.
The only way this will be mitigated is if the U.S. Federal Reserve continues to expand its asset purchase program. It may have no other choice but to do so.
That’s what Japan has done over the last 15 years.
It’s also what we’ve seen happen in the natural resource industry. I’ve previously talked about “Extend & Pretend”, first in the oil patch, and later on in the gold mining sector…
I called exactly what happened to the oil companies. Where the worst ones went bankrupt but most managed to delay by refinancing their debt.
If we expect that to be the case again here…
We will have short windows of volatility and sharp corrections until the Fed moves quickly enough to backstop the bond market.
Then our game plan will be to do exactly what we did in March 2020, which played out exceptionally well for me and my subscribers.
However, this time, I promise to try not to be too cheap!
Bond Whispers
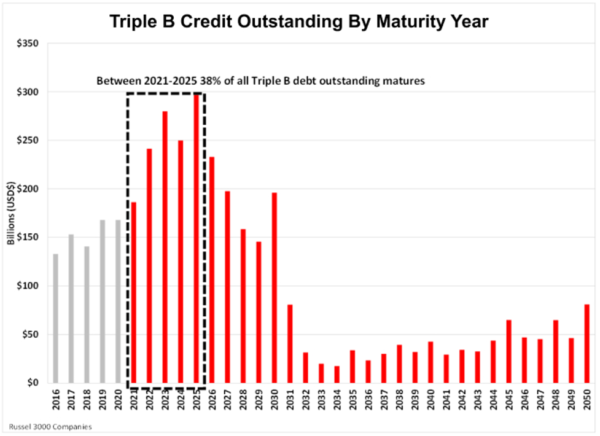
The Russell 3000 Index is an index composed of the 3,000 largest publicly listed U.S. companies.
It is one of the most all-encompassing indexes and it includes companies with trillion-dollar market caps all the way down to $200 million market caps.
This provides a solid barometer of the required refinancing of corporate debt in the U.S.
Below is a chart which shows total debt by maturity year for companies in the Russell 3000 Index. There is a wall of debt maturing in the next few years.
And here we can see the High Yield debt maturing in the coming years…
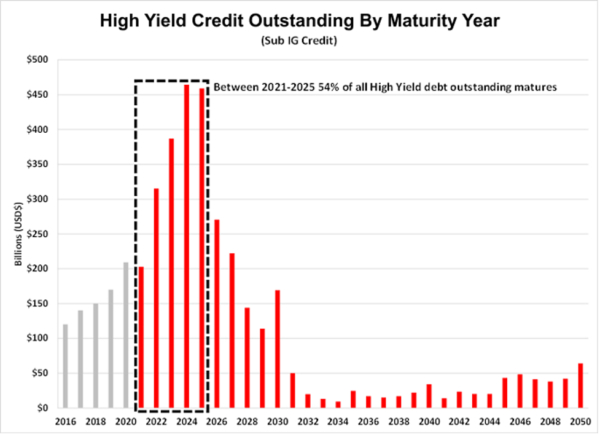
The combined corporate “debt wall” could be a catalyst for a future major market correction.
You can see that the previous years shaded in grey are half the size of the upcoming maturities.
Where it gets interesting is that on average, companies in the Russell 3000 today have far more debt relative to earnings than in past history.
This debt wall isn’t the only thing that’s on my radar, however…
The Buffet Indicator is Sounding an Alarm…
Warren Buffett has gone on a money-making spree in 2020.
Backing big winners like Snowflake and trimming positions for a profit, Buffett knows quite well that it’s not a gain until you sell.
Previously, I detailed how Buffett’s right-hand man for half a century, Charlie Munger, said that stocks will all but remain flat for the coming years.
Two of the most famous investors in history might have had their simple Buffett Indicator to give them a warning. For those of you who aren’t aware, the Buffett Indicator is simply the total market cap of all U.S. stocks, divided by U.S. national GDP.
In other words, it shows the historical valuation of the markets relative to the strength of the economy those companies are built on:
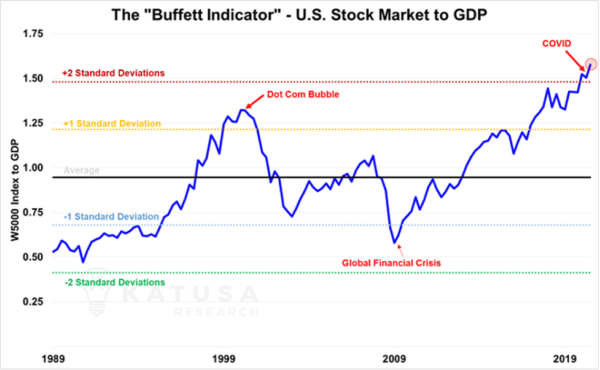
Of course, the Buffett indicator alone doesn’t tell the whole story.
Given the zero, or even negative-interest-rate environments we find ourselves in, it only makes sense that people would look for their returns on the stock markets instead.
Still, it’s undeniable that there continues to be a significant disconnect between the hype in the stock markets and the state of the economy right now.
How to Protect Yourself in a Correction
Between the unfounded optimism in the small caps…
The oncoming Debt Wall of Worry…
The Buffett indicator and other signals…
An eventual market correction seems more and more likely with each passing day. You need to prepare for that risk.
In a previous piece, I discussed how gold stocks have sold off during past market corrections. And it’ll happen again when the overall markets sell off.
Oil stocks will also get hit. So, we need to think about protecting ourselves against these declines.
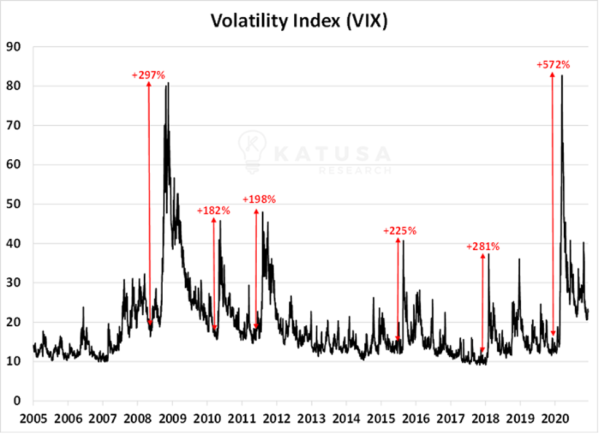
The Volatility Index (VIX) is a useful tool, which we can use to “buy protection”.
The Volatility Index is a forward-looking index which is derived from S&P 500 option pricing. As market turmoil increases, the Volatility Index increases. And then as the turmoil subsides, the VIX decreases.
Below is a chart which shows the VIX since 2005. You’ll see the largest spikes were in the 2008 financial crisis and then in March as the Pandemic took hold.
Now, you can’t buy the VIX itself.
But there are investment products which reflect, in the broadest sense, the same type of movement. These can provide the protection we’re looking for.
The most well-known and actively traded instrument which reflects the VIX is the Exchange Traded Note ‘VXX’.
The VXX is an investment product created by Barclay’s, a major European financial institution.
We need to be particularly careful on timing VXX for several reasons:
- As the market goes higher, the VXX will trend lower.
- Due to its construction, the VXX mathematically could go to zero if there’s never any future volatility – though this is highly unlikely.
Also, this type of hedge is for ACTIVE traders only.
You can miss your payoff if you’re even one day late. I don’t recommend going this route for almost all of our readers, except perhaps the ones who glued to their screen 24/7 as active traders.
Life is too short to bother with that IMO.
However, for those who are active traders, why would you buy something that could mathematically go to zero?
Using a small percentage of a total overall portfolio…
VXX has the capability to offset a substantial portion of unrealized & realized losses that could occur if we had another sharp correction.
For the rest of you who aren’t active day traders, however, you can take a look at how I’m planning to protect myself and my subscribers.
Editor’s Note: In this urgent video, legendary speculator Doug Casey and resource expert Marin Katusa discuss exactly what they’re doing to protect themselves and profit from the urgent opportunity unfolding right now.
Click here to see it now.